

Introduction
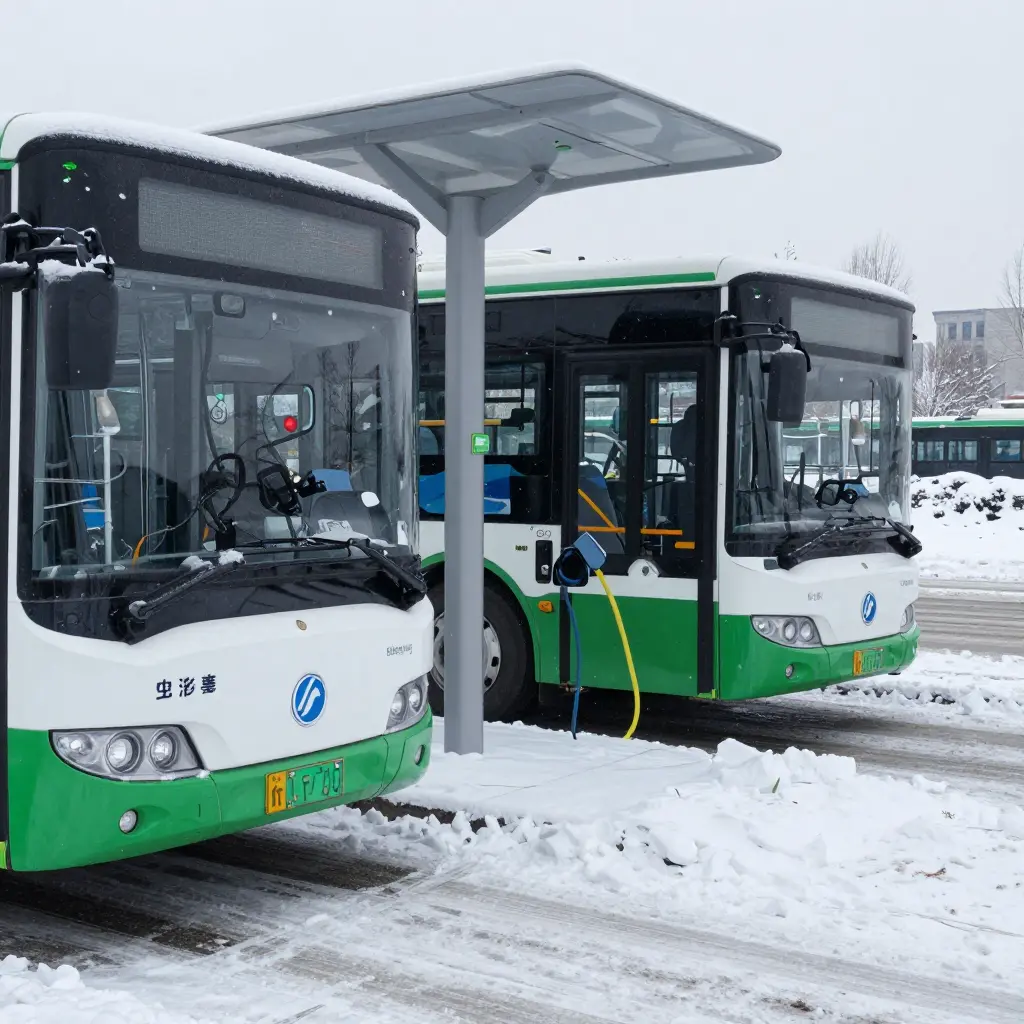
At a cold climate electric bus depot, the power figure printed on a charger’s nameplate seldom matches the energy an electric bus actually receives. Manufacturers rate output at standard reference conditions: around 20 °C, nominal grid voltage, a moderate state of charge, and thermal management under no particular stress. A winter depot meets none of those conditions, so planning documents built on nameplate values tend to overstate the capacity actually available.
The gap is widest when it is coldest. As ambient temperature falls, cell internal resistance rises, the battery management system imposes charge-current limits, and cable and connector losses grow. Those effects stack. A 150 kW charger can deliver well under half its rating during a February overnight dwell. That matters for depot sizing, schedule design, and fleet availability, all of which depend on delivered energy rather than rated energy.
The same gap shows up one level up the chain, in depot power upgrades that stall electric bus fleets when infrastructure is sized on rated rather than delivered capacity.
How Cold Temperatures Reduce Battery-Accepted Power
A charger’s nameplate rating describes what the equipment can deliver. It says nothing about what the battery can safely absorb. In cold climates, that distinction is where fleet planning goes wrong. Even a 150 kW charger cannot force 150 kW into a pack whose chemistry and controls forbid it, and the limit sits inside the cells rather than in the wiring outside them.
Battery chemistry slows down when it is cold
Lithium-ion charging depends on ion mobility through the electrolyte and across the electrode surfaces. Cold thickens the electrolyte, lowers ionic conductivity, and raises the internal resistance of every cell. Push the same current through a colder cell and the voltage rises further while the cell generates more internal heat, quickly reaching the upper voltage limit the battery management system (BMS) is programmed to respect. The BMS reduces current in response. This is battery derating in its simplest form, driven by cell condition rather than charger capability. Once temperatures drop well below freezing, many bus packs accept only a fraction of their warm-weather charge rate, a drop of 50 percent or more that no charger upgrade can erase.
Lithium plating risk forces conservative limits
Charge a cold cell too aggressively and lithium ions fail to intercalate into the graphite anode, depositing instead as metallic lithium on its surface. This is lithium plating. It consumes active lithium and usable capacity, shortens cycle life, and can create conditions that lead to internal short circuits. Because the risk climbs at low temperature and high current, BMS logic deliberately caps charge current until the cell warms. That is why a winter fast-charge session can look far slower than the equipment specification suggests, and why operators and suppliers end up arguing about what “rated” power means, a pattern documented in these accounts of battery warranty and fast-charging disputes.
Cell heating demands energy before charging even starts
Charging in the cold rarely begins at full current. Most bus packs first run an internal heater or a controlled low-current warm-up phase to bring cell temperature into a range where fast charging is safe. That warm-up consumes both time and energy, and accepted power stays low by design until the pack reaches its target window. A pack that needs 20 to 40 minutes of preconditioning has given up that time from any realistic dwell-window calculation.
Thermal management adds overhead on top
Heating is not free. Cabin HVAC, battery coolant pumps, and resistive heaters draw on the same supply the pack is trying to charge from. Thermal management can consume several kilowatts continuously on a cold day, so part of the charger’s output goes to keeping the battery and the bus habitable instead of adding range. The chart below shows how accepted power separates from charger rating as conditions worsen.
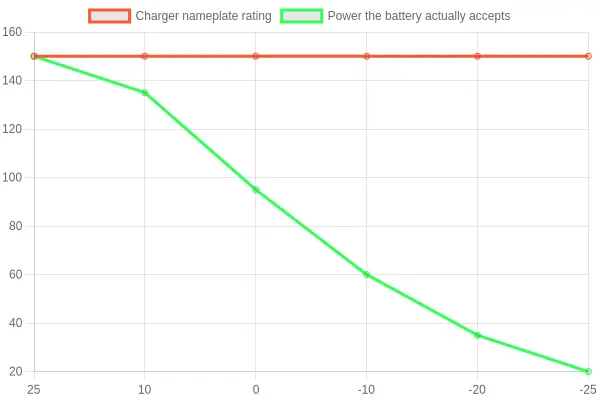
For planners and transit authorities, the useful conclusion is that usable charging power in a cold climate is a battery property first and a charger property second. Sizing a depot on nameplate ratings alone overstates throughput every winter morning.
Charger Rating vs. Usable Power: The Cold-Weather Gap
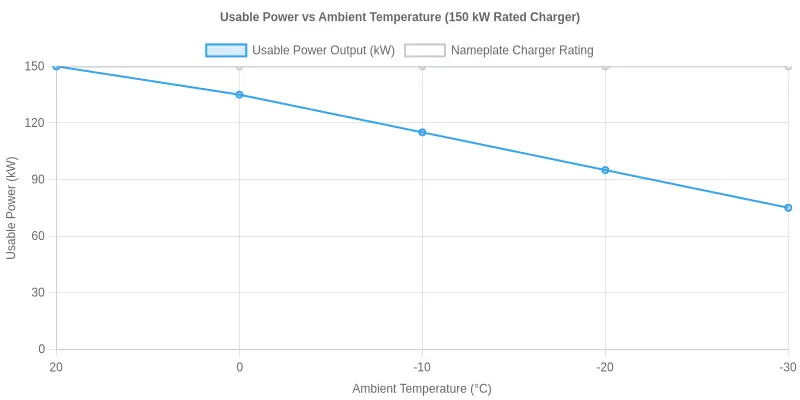
The chart below plots two lines against ambient temperature from -30°C to +20°C. The flat solid line is the nameplate charger rating, a constant 150 kW that the depot buys and pays for. The dashed line is the usable power the charger can actually push into a bus battery at each temperature.
In mild weather the two lines converge, and the bus takes the full rating. As the temperature falls, the usable-power line pulls away sharply, bottoming out near 35 kW at -30°C. That is a loss of roughly three-quarters of the rated capacity, caused by lower battery acceptance, heater loads, and derated power electronics.
Caption: Nameplate charger rating stays flat at 150 kW, while usable power delivered to the battery falls sharply below freezing and recovers only near +15°C. Size depot power around the cold-temperature curve, not the nameplate number.
For context on how undersized depot infrastructure compounds this problem, see our analysis of why electric bus fleets stall during depot power upgrades.
Reading Between the Lines: What the Chart Reveals About Winter Charging
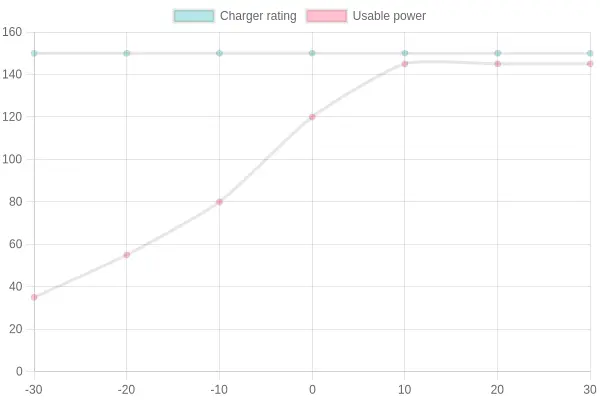
In mild weather the two lines in the chart sit almost on top of each other near the top of the scale. Follow them left toward freezing and they separate quickly.
The teal line is the charger rating, the number on the spec sheet and the nameplate figure quoted in tenders and grant applications. It holds near 150 kW across the entire temperature range, which makes it look like a dependable flow of energy whatever the weather does.
The pink line is the usable power, what the bus battery can actually accept at a given moment. Warm, it tracks the rating almost exactly. Cold, it collapses: roughly 120 kW at 0 °C, 80 kW at -10 °C, 55 kW at -20 °C, and about 35 kW near -30 °C.
Where the Divergence Hurts Most
The gap is widest between -10 °C and -30 °C, the range that defines winter operations across much of northern Europe, Canada, and northern China. There the charger still advertises 150 kW while the vehicle absorbs a quarter to a half of it. The shaded wedge between the lines is unclaimed capacity, not a rounding error.
For a cold climate electric bus depot, this is a planning constraint rather than a footnote. Connection capacity, transformer upgrades, and charge schedules are usually sized around high charger ratings, on the assumption that buses will absorb that energy overnight. When usable power sags, dwell times stretch, peaks shift later, and a staggered schedule turns into congestion. A fleet that looks fully charged on paper can wake up short on range.
Turning the Chart Into Depot Decisions
The practical response is to stop treating the nameplate number as a planning input. Model depot load with charger expectations derated to the temperatures the site actually experiences, then add margin. That usually means more charging bays rather than bigger chargers, cabin and battery pre-conditioning before plug-in, and an honest conversation with the utility about winter demand. It also argues for examining the wider infrastructure picture, from depot power upgrades that keep fleets moving to pre-conditioning strategy, before committing to a charging architecture.
A charger rating is a ceiling, not a promise. In a cold climate, the distance between that ceiling and the power a bus can actually draw decides whether a winter morning runs smoothly or stalls on the pad.
Charger Nameplate Ratings vs. Usable Power at the Bus Battery
A charger’s nameplate rating describes what the unit can deliver under ideal lab conditions, not what reaches your bus battery on a frigid depot morning. The table below sets five common nameplate ratings against the power a bus battery is estimated to accept at three ambient temperatures. Because cold cells resist charge, a “360 kW” charger rarely behaves like one in winter.
| Nameplate Rating | Usable Power at -20°C | Usable Power at 0°C | Usable Power at +20°C |
|---|---|---|---|
| 60 kW | ~27 kW | ~42 kW | ~54 kW |
| 120 kW | ~54 kW | ~84 kW | ~108 kW |
| 180 kW | ~81 kW | ~126 kW | ~162 kW |
| 240 kW | ~108 kW | ~168 kW | ~216 kW |
| 360 kW | ~162 kW | ~252 kW | ~324 kW |
How to read this table: Each row starts with the charger’s advertised nameplate rating, then shows the estimated power the battery accepts at -20°C, 0°C, and +20°C. Read across a row to see how much of the nameplate value survives the cold; the gap widens sharply as temperatures fall. Read down a column to compare how different chargers degrade under the same conditions. The figures are illustrative planning estimates. Real values vary with battery chemistry, state of charge, thermal management, and cable losses, which is one reason depot power upgrades often stall when fleets size infrastructure around nameplate numbers alone.
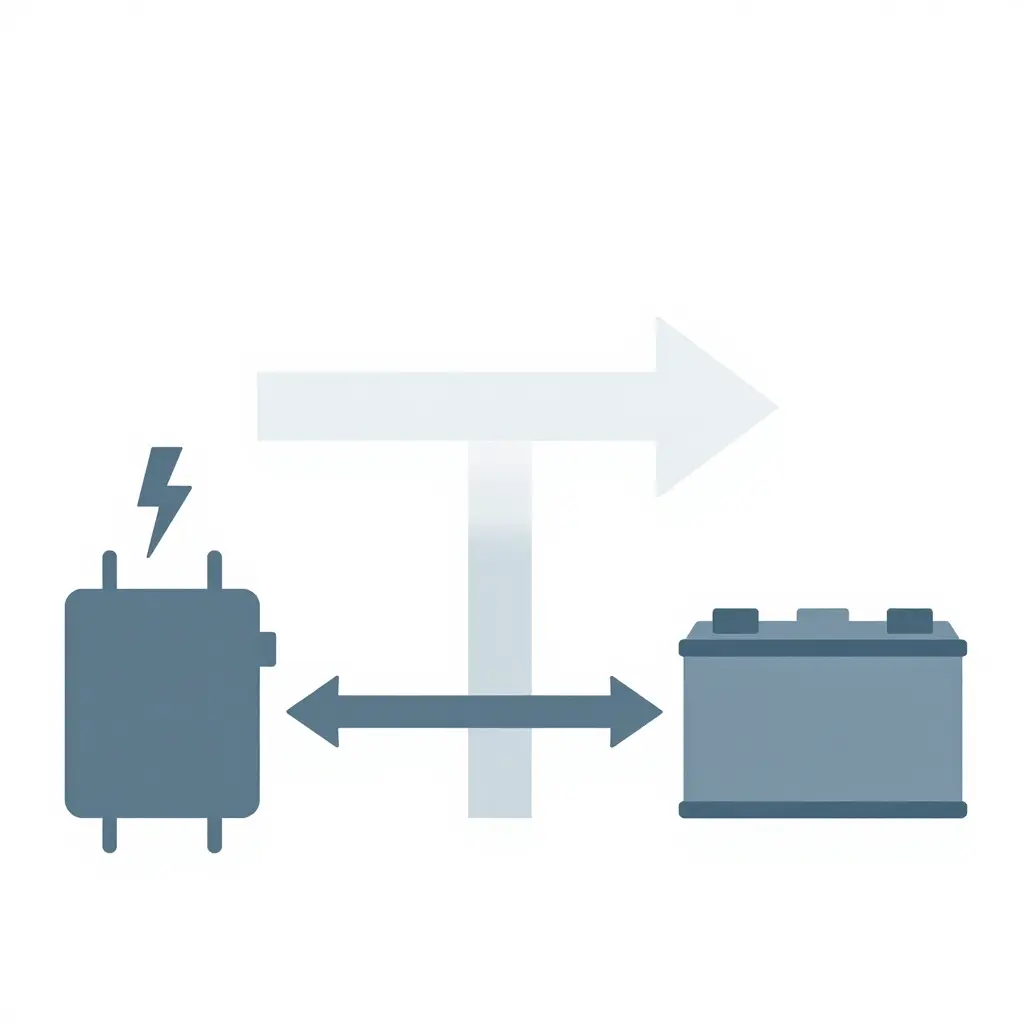
Reading the diagram above: The charger unit on the left represents a nameplate rating, the number on the spec sheet. The wide arrow is the energy transfer the charger claims it can deliver. The vertical barrier is cold temperature acting as a constraint on the electrochemistry inside the battery. The wide arrow stops at the wall while only a thin arrow reaches the battery. That reduced flow is the usable power, and in cold weather it is always smaller than the headline rating. A depot plan built on nameplate numbers alone can quietly strand a fleet.
How Depot Power Infrastructure Interacts with Usable Power in Cold Climates
Planning a cold climate electric bus depot usually starts with charger nameplate ratings. A 180 kW unit sounds like 180 kW of reliable power, and fleet math gets built on that number. In practice, the power a charger can deliver is shaped by everything upstream of the plug: the transformer, the grid feed, and how the site manages load across dozens of buses charging at once. Those interactions decide whether a depot performs in January or quietly throttles when it is needed most.
Transformer capacity sets the real ceiling
The transformer serving a depot is the true bottleneck for depot charging infrastructure. It is often sized for average demand rather than the simultaneous peak that occurs when a fleet returns in a block and plugs in at once. Cold weather sharpens that peak. Battery heaters, cabin preconditioning, and cold-soaked packs all draw power before meaningful energy reaches the cells, pushing demand above mild-weather estimates. As the cumulative draw approaches transformer limits, chargers reduce output to protect equipment, so a site rated for high capacity delivers far less during the coldest hours.
Grid supply and service limits
Beyond the transformer, the utility service entrance and demand charges shape behavior. Many depots sit on a fixed service size that cannot be expanded without costly upgrades. When grid supply is constrained, load management systems stagger charging, spreading the same total energy across a longer window. That is how a depot can look fully equipped and still deliver only a fraction of its installed capacity to any single bus at a given moment.
Load management reshapes delivered power
Load management is the control layer that decides who charges and when. It balances transformer headroom, utility demand charges, and fleet readiness. In cold weather it must also account for slower charge acceptance as batteries warm. Delivered capacity then depends less on the charger label than on how well the site distributes its finite power budget. A well-tuned system prioritizes buses with early departures and defers flexible ones, keeping usable power where it matters.
Installed capacity versus delivered capacity
Installed charging capacity and delivered capacity are not the same thing. Installed capacity is the sum of charger ratings on paper. Delivered capacity is what reaches batteries after transformer limits, grid constraints, load management, and cold-weather losses are applied. In deep winter the gap between the two can be substantial, and fleets that plan on nameplate numbers may find their operational range shorter than expected.
Planners who model delivered capacity honestly avoid surprises. To see how upstream power constraints cause fleets to stall, review this breakdown of why electric bus fleets stall during depot power upgrades. Treating the depot as one integrated power system, rather than a collection of chargers, is the most reliable way to keep a cold climate electric bus depot running through winter.
What Really Eats Into Your Charger’s Rated Power?
A 300 kW nameplate on a depot charger does not mean 300 kW reaches a bus battery on a freezing January morning. Cold-climate depots stack several losses, and the chart below breaks down the estimated share each cause contributes to the gap between charger rating and usable power.
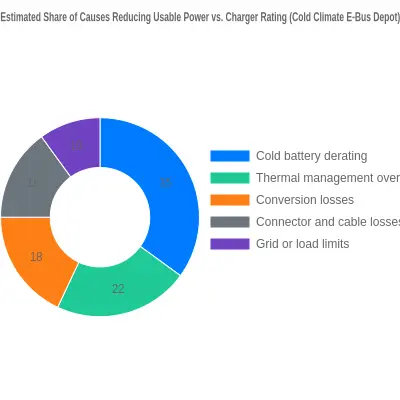
Caption: Estimated share of causes reducing usable power versus charger rating at a cold-climate electric bus depot. Cold battery derating dominates, but thermal management, conversion, cabling, and grid constraints each take a meaningful share of their own.
Reading the Slices
- Cold battery derating (35%): The largest factor. Below roughly 0 °C, lithium-ion cells accept charge more slowly to avoid plating, so the pack itself limits what it will take.
- Thermal management overhead (22%): Heaters and coolant pumps must warm the pack before fast charging is safe. That energy conditions the battery rather than moving the bus.
- Conversion losses (18%): AC-to-DC rectification and voltage stepping inside the charger and onboard equipment lose energy as heat.
- Connector and cable losses (15%): Resistance in high-current cabling, contactors, and plugs grows with long cable runs and imperfect connections.
- Grid or load limits (10%): Shared site transformers and demand charges can cap output when several buses plug in at once.
These factors compound rather than simply add, which is why depot infrastructure should be sized around realistic winter throughput, not summer peak ratings. Understanding why depot power upgrades stall is a useful next step when turning these shares into an actual charging schedule.
How Usable Power Is Measured and Reported
A charger rating is a laboratory promise, not a depot guarantee. When a manufacturer stamps “150 kW” on a DC fast charger, that figure describes the maximum output the unit can deliver under a tightly controlled set of conditions defined by standards such as IEC 61851 (conductive charging systems), IEC 62196 (connector and socket types), ISO 15118 (vehicle-to-grid communication and Plug & Charge), and, for buses specifically, SAE J3105 for automated overhead connection. Those standards specify cable ampacity, communication protocols, insulation monitoring, and safety interlocks. None of them requires a manufacturer to publish a derated curve across the ambient temperatures a real fleet actually faces.
The result is a gap between the advertised charger rating and usable power. Usable power is the energy a bus can genuinely absorb at a given moment, given battery temperature, state of charge, the vehicle’s own onboard limits, and the ambient environment. For electric bus charging to be planned credibly, procurement teams must compare that realistic figure, not the nameplate number on the datasheet.
Test Conditions and Temperature Assumptions
Most ratings are established at an ambient temperature of roughly 20-25°C, with a battery pack already warmed to its optimal window (commonly 20-35°C), grid voltage at nominal, and a state of charge low enough that the cells are not yet tapering current. Every one of those assumptions is optimistic in a northern winter. Cold cells have higher internal resistance, so the battery management system deliberately throttles charge current to prevent lithium plating. Cables stiffen, connectors can frost, and grid voltage may sag when neighboring depots draw heavy heating loads. The charger is capable; the system around it is not.
Why Charger Rating Labels Overstate Cold Performance
Consider a unit labelled 150 kW. At a mild 20°C it may deliver close to the full figure. At -20°C usable power can fall by half or more, because the vehicle, not the charger, becomes the bottleneck. A charger rating tells you what the equipment could do in a climate chamber, not what a fleet sees at 06:00 on a January morning. Planners who size transformer capacity, set pull-out times, and cost out energy contracts around nameplate figures routinely overestimate throughput and underestimate the number of charge points they need.
The Value of Telematics-Based Monitoring
The reliable way to close this gap is measurement in the field. Telematics platforms log actual power delivered, session duration, battery temperature, and fault codes across every charging event, replacing scattered anecdotes with a defensible performance baseline. That data shows whether a shortfall comes from weather, a misbehaving charger, or an aging pack, and it provides evidence when warranty disputes arise. Operators who monitor continuously often find that apparent capacity problems are really reliability problems, a distinction covered in this guide to electric bus telematics catching charge point faults. In cold climates, telematics is what separates a charger rating you hope for from usable power you can actually schedule.
Power flow schematic: where cold weather eats your charge
The schematic is deliberately bare. It strips a cold-climate depot to a left-to-right chain of shapes and arrows showing power as it travels from the grid supply toward the charger and finally into the bus battery. The starburst marks along the chain flag the points where energy leaks away or the flow is throttled before it ever reaches the pack.
Read it as a pressure line rather than an electrical one. What enters on the left is not what lands on the right, and in winter the difference widens fast.
The three stages, in plain terms
- Grid supply to charger. The station receives whatever the local network can deliver at that moment. Cold snaps often coincide with demand peaks, so the ceiling here is set by infrastructure, not by the charger’s nameplate.
- Charger to charge point. This is the stretch where a headline rating gets tested. A charger marketed at a high kilowatt figure holds that figure only while its internal electronics and cable stay warm. In freezing air, the hardware self-protects and reduces output.
- Charge point to battery. The final hop depends on the pack. A cold lithium battery refuses current until its cells are warm enough to accept it, so early charging energy goes to heating rather than storage.
Why the loss points matter
Each starburst on the schematic represents a real budget line that planners tend to ignore when they size a depot on paper. They compound. A reduced grid allowance, a de-rated charger, and a cold pack do not simply add up; they multiply, which is why a depot that looks generously provisioned in summer can stall a fleet on the coldest mornings. Transit authorities who plan around nameplate numbers end up measuring downtime instead of throughput. Understanding where the chain narrows is the first step toward fixing it, and it pays to review how depot power upgrades address grid-side bottlenecks before new chargers are specified.
Overlay your own depot’s numbers on each arrow and starburst and the weakest link becomes obvious. That is more useful than arguing over a spec sheet, because it points to the specific stage where winter takes your usable power.
Frequently Asked Questions: Cold Climate Electric Bus Depot Charging
Planning a fleet is hard enough without surprises on the first freezing morning. These are the questions transportation planners, manufacturers, and transit authorities ask most often about why a charger rating so rarely equals the usable power buses actually get.
Why do charger ratings differ from usable power?
A charger rating describes the peak a unit can deliver under ideal, bench-tested conditions: moderate ambient temperature, a battery willing to accept full current, and a site electrical supply with headroom to spare. Usable power is what actually reaches the battery once real-world losses and limits are applied. In a cold climate electric bus depot, that gap widens fast. Cable resistance, thermal-management loads, voltage sag, shared transformer capacity, and battery acceptance limits each shave away at the nameplate number. A unit labeled 150 kW may deliver only 90-110 kW on a freezing morning, and less as conditions worsen. Treat the nameplate number as a maximum, not an expectation.
How does cold temperature affect battery charging?
Lithium-ion chemistry slows when it is cold. The electrolyte thickens, lithium-ion mobility drops, and the pack’s internal resistance climbs. The battery management system responds by capping charge current to protect cells from lithium plating, which permanently reduces capacity. Below freezing, many packs cannot accept high current at all until warmed. Energy that should flow into the battery is diverted, sometimes for 20 to 40 minutes, into heaters before meaningful charging starts. The plug is connected and the charger is capable, yet usable power stays low until the pack reaches a workable temperature.
How do I calculate realistic depot power needs?
Start with nameplate assumptions, then subtract reality. For each route, estimate daily energy use in kWh from distance, duty cycle, and heating loads; winter heating alone can add 30-50% to demand. Add charging-window constraints: if buses must be ready in six hours, divide required energy by that window to find the true average power needed. Apply a cold-climate derating factor of roughly 0.6 to 0.75 of the charger rating, then add a diversity factor, since not every bus charges at peak at once. Finally, check the site transformer and switchgear, because depot-level limits often bind before the chargers do.
Does preconditioning actually help?
Yes, and it is among the highest-return measures available. Preconditioning warms the battery, and often the cabin, while the bus is still plugged in, using grid power rather than the pack’s own energy. A warm battery accepts far higher current, pushing usable power closer to the charger rating and shortening dwell time. It also preserves range, because the bus does not spend stored energy heating itself on the road. The catch is that preconditioning draws power, so it must be scheduled into the depot load profile. Timed, staggered preconditioning smooths demand peaks instead of triggering expensive peak charges.
How can I verify usable power in practice?
Instrument the system and watch real conditions. Compare kWh delivered to the battery against the charger’s metered output, logging ambient temperature, state of charge, and battery temperature at the same time. Platforms built to catch charge point faults can flag points where delivered energy falls far below expectations. Look for patterns by time of day and season: if usable power collapses every January morning, you have found a temperature-derating issue, not a broken charger. Only this kind of measurement closes the gap between the charger rating on the datasheet and the usable power your cold climate electric bus depot can truly count on.
Conclusion
The evidence points to one practical conclusion: in a cold climate electric bus depot, the charger rating on a spec sheet is a marketing figure, not a working promise. It describes peak output under warm, idealized conditions. The usable power that reaches a bus battery on a freezing winter night is lower, often 20 to 40 percent lower, because cold cells resist current, the battery management system tapers demand to protect pack health, and shared depot infrastructure divides scarce power across many vehicles at once.
The evidence points the same way from several directions. Cell chemistry sets the root cause: low temperatures raise internal resistance and force conservative charge acceptance. Advertised kilowatts fall away as soon as thermal management engages, and at depot scale, simultaneous plug-in lets transformer limits and demand charges cap total throughput well below the sum of individual charger ratings. Over a fleet’s operating life, faults and derated sessions eat further into usable power.
For planning, the conclusion is direct. Size a cold climate electric bus depot around measured winter performance, not rated capacity. Model charge acceptance at the lowest expected ambient temperature, derate for power sharing and thermal losses, and validate assumptions with pilot data before fixing fleet size or route blocks. A charger rating that looks generous on paper can leave buses partly charged and routes uncovered when conditions bite hardest.
Transportation planners should build schedules and dwell times around winter-verified usable power, with a deliberate buffer for the coldest weeks. Manufacturers should publish honest cold-weather charge curves and invest in thermal management that lets vehicles approach their potential in freezing conditions. Transit authorities should require performance guarantees tied to real depot temperatures and treat depot power capacity as a strategic asset rather than a checkbox. The distance between a charger rating and the power a bus can actually draw is what decides whether a fleet runs through winter or waits on the pad.