

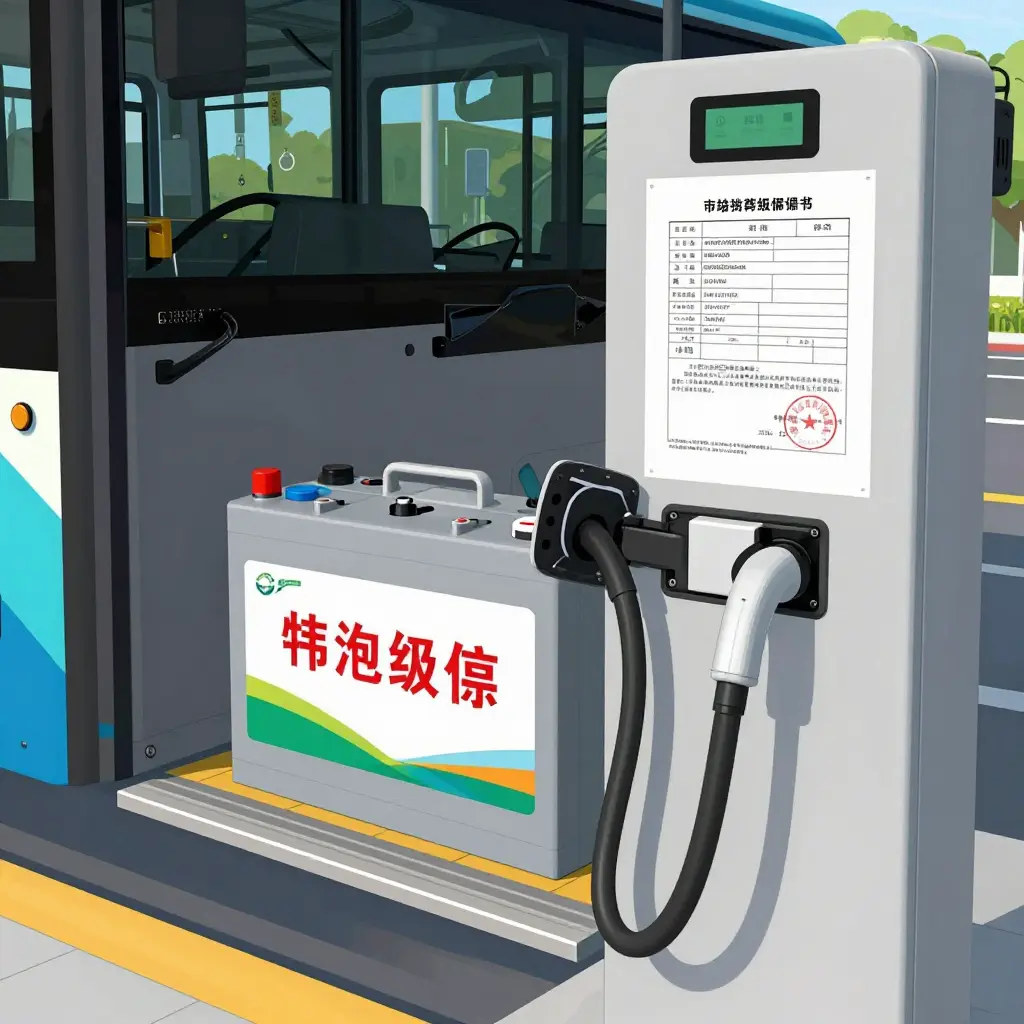
An electric bus battery warranty is a manufacturer’s written promise that a traction battery will hold a defined level of usable capacity, performance, and safety for a set period, usually counted in years or charge cycles. It spells out what the manufacturer will repair, replace, or pay for when the pack drops below agreed thresholds. Most policies cover defects, premature capacity loss, and thermal events. They also list the operating conditions that void protection.
Fast charging is the most common trigger of warranty claim disputes. High-power charging speeds up lithium-ion degradation, raises cell temperatures, and pushes packs past the usage profiles many warranty documents assume. When capacity falls faster than expected, fleets file claims and manufacturers push back, arguing the charging routine exceeded approved limits.
Electric bus operators, fleet managers, and others who negotiate, administer, or challenge these agreements have to read the clauses closely. Charging infrastructure shapes battery health, so how depot power upgrades affect fleet reliability matters as much as the warranty text. What follows covers warranty clauses, degradation data, dispute triggers, supporting evidence, and the practices that lower claim risk.
How Fast Charging Interacts with Battery Warranty Terms
When an electric bus plugs into a high-power charger, two things happen at once: the operator gains schedule flexibility, and the battery takes on stress the warranty may not forgive. The engineering and the fine print do not always agree.
The Physics of Battery Degradation Under High Power
Fast charging drives lithium ions into the anode faster than the cell was built to accept them. Over time that promotes lithium plating, electrolyte breakdown, and structural stress on the cathode. Capacity fades sooner and internal resistance climbs, cutting both driving range and available power. Degradation is rarely linear, and a bus that fast charges daily will usually lose usable capacity well before one that charges gently overnight.
Why Manufacturers Set Charging-Rate Thresholds
To protect the pack, manufacturers write warranty conditions that set maximum continuous charge rates, caps on daily or monthly high-power events, and acceptable temperature windows. Charging above the rated C-rate, running past a set number of fast-charge cycles, or charging in extreme cold or heat can void coverage for specific failure modes.
Who Owns the Risk When Limits Are Breached
If telematics show a bus routinely exceeded those parameters, responsibility for premature failure can shift from the manufacturer to the operator. That is why disputes turn on charge logs rather than range claims.
How Depot Infrastructure Drives Charging Habits
Weak grid connections push fleets toward aggressive high-power sessions to make up for limited overnight capacity. Fixing that bottleneck usually means upgrading site power, and the operational knock-on effects are covered in these notes on depot power upgrades. Upgrading the depot is often the least visible way to stay inside warranty conditions and keep the schedule intact.
Decoding Key Electric Bus Battery Warranty Clauses
An electric bus battery warranty is only as good as the clauses in its fine print. Those terms decide whether a battery warranty claim succeeds. The provisions below most often determine the outcome.
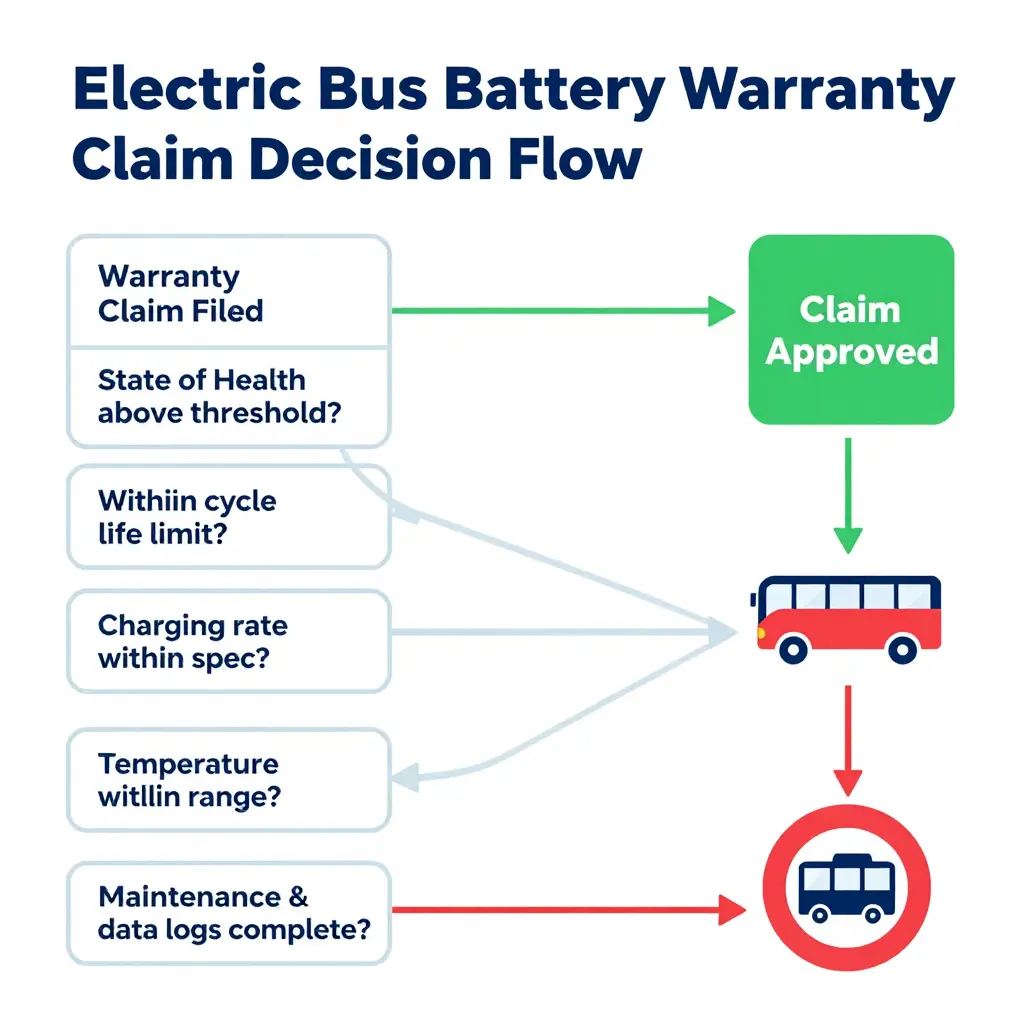
The State of Health Threshold
Most warranties define coverage by state of health, a percentage of original usable capacity. The common threshold is 70 to 80 percent. If capacity drops below that line inside the warranty period, the pack may qualify for repair or replacement.
Normal vs. Abnormal Degradation
Policies cover abnormal degradation and exclude normal wear. Normal degradation is the gradual capacity loss expected from everyday use. Abnormal degradation includes cell failure, thermal events, or premature decline. Because “normal wear” is rarely defined numerically, the two sides can read the same clause differently.
Calendar Life vs. Cycle Life Limits
Coverage is capped by two clocks: calendar life, measured in years regardless of use, and cycle life, measured in charge/discharge cycles. Whichever runs out first usually ends coverage, even if the other still has room.
Charging-Rate Restrictions
Many policies require charging within a specified rate. Frequent high-power fast charging accelerates degradation and gives the manufacturer grounds to deny a claim. Depot infrastructure shapes how fleets charge, as this guide to depot power upgrades for electric bus fleets explains.
Ambient Temperature Limits
Operating or storing the bus outside a defined temperature range can void coverage. Repeated exposure to extreme heat or cold is usually treated as owner-caused stress, not a defect.
Maintenance and Data-Logging Obligations
Warranties usually require documented servicing and continuous battery management system (BMS) data. Missing logs can sink an otherwise valid claim.
The Exclusions List
Standard exclusions cover physical damage, flooding, unauthorized repairs, aftermarket modifications, and operation outside the specified conditions.
Why ‘Normal Wear’ Wording Creates Ambiguity
Vague wording around normal wear leaves room for argument. A manufacturer may call steady capacity loss “expected”; an operator sees failure. With no defined rate of decline, the outcome often rests on interpretation rather than data. The table below sums up the clauses that matter most.
| Clause | Typical warranty language | What actually decides the claim |
|---|---|---|
| State of health | “Below 70-80% of rated capacity” | Measured SOH versus threshold |
| Degradation type | “Excludes normal wear” | Evidence of abnormal failure |
| Life limits | “Whichever comes first” | Calendar or cycle count |
| Charging rate | “Within approved limits” | Logged charging current |
| Temperature | “Within operating range” | Ambient and sensor data |
| Maintenance | “Records must be retained” | BMS logs and service history |
| Exclusions | “Misuse and damage” | Verified cause of failure |
Knowing these clauses before a failure occurs puts operators in a stronger position when the warranty question comes up.
Battery Warranty Coverage by Charging Profile
The same pack can land in very different warranty territory depending on how it is charged.
| Charging Profile | Typical Charging Rate | Expected Cycle Life | State-of-Health Threshold at Claim | Typical Warranty Stance | Common Exclusion Cited |
|---|---|---|---|---|---|
| Overnight slow charging | 0.1-0.3C (AC, ~30-50 kW) | 6,000-8,000 cycles | 70% | Usually honored without dispute | Rarely cited; standard wear only |
| Moderate depot charging | 0.5-1C (DC, ~50-150 kW) | 3,500-5,000 cycles | 70% | Usually honored with care | Isolated over-temperature events |
| Frequent opportunity fast charging | 1.5-3C (DC, ~150-350 kW) | 2,000-3,000 cycles | 70% | Frequently contested | “Excessive fast-charge cycling” or abuse clauses |
| Continuous ultra-fast charging | 3-6C (DC, ~350-600 kW) | 1,000-1,500 cycles | 70-80% | Often denied or heavily pro-rated | Operating outside the recommended charge window / thermal abuse |
Move from gentle overnight charging to continuous ultra-fast charging and cycle life can fall to a fraction of its original value while the warranty threshold stays fixed, so the pack crosses that line far sooner. Fast charging also produces the thermal and cycling stress manufacturers cite when they invoke abuse or misuse exclusions, and even legitimate claims then face heavier scrutiny. Faster charging does not just shorten battery life; it quietly stacks the odds against a successful claim. That trade-off is worth weighing before a fleet commits to high-power charging, especially when depot power upgrades force charging trade-offs.
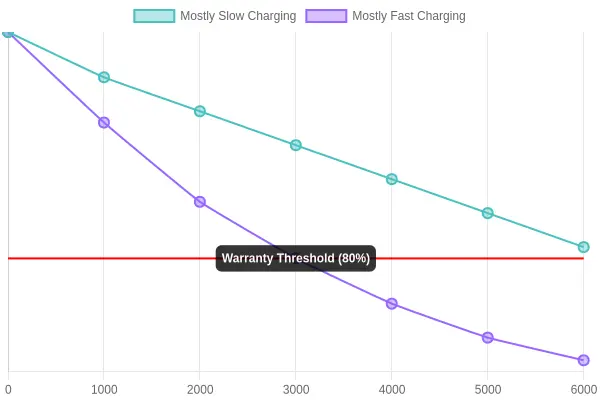
Chart: Battery capacity retention (%) over cumulative charge cycles, comparing mostly slow charging against mostly fast charging, with an 80% state-of-health warranty threshold marked.
What the Two Lines Are Telling You
The chart shows what operators end up paying for. Buses on a mostly slow-charging routine stay comfortably above the 80% state-of-health line even after 6,000 cycles; fast-charged buses drop below it between 2,000 and 3,000 cycles, roughly half the life. When the warranty is written around an 80% capacity guarantee, that earlier crossing point becomes the flashpoint. Operators see ordinary fleet wear; manufacturers attribute the faster decline to charging outside the recommended profile. The gap in expectations is why charging habits deserve a hard look before any warranty conversation, and why it pays to review the depot power setup that shapes how quickly fleets can charge.
Fast Charging Habits That Trigger Warranty Claim Disputes
Battery packs rarely fail from one dramatic event. More often the damage builds quietly through daily routines that seem harmless at the time. When a pack loses capacity or overheats, manufacturers go through the charge logs, and the fast charging habits below are the ones most often cited in warranty claim disputes. Depot setup shapes these behaviors: limited power at the plug frequently forces operators into exactly these routines, a problem examined in this look at depot power upgrades and why electric bus fleets stall.
- Exceeding the recommended charging rate – Pushing current past the manufacturer’s specified C-rate stresses individual cells and speeds up lithium plating. It is one of the fastest ways to lose coverage.
- Charging to full at high power – Topping a pack to 100% at maximum power leaves no headroom for thermal expansion and is routinely flagged as abuse in a warranty investigation.
- Repeated deep discharges before fast charging – Draining the pack close to empty before plugging in creates deep depth-of-discharge cycles that age cells faster than the design allows.
- Charging in extreme temperatures without preconditioning – Plugging in during freezing or scorching weather without warming or cooling the pack first can cause lasting damage the manufacturer treats as operator error.
- Ignoring manufacturer charging cycle limits – Splitting daily charging into several rapid sessions inflates cycle counts and can push a pack past its rated lifetime ahead of schedule.
- Failing to record charging data – Without telematics or logs, operators cannot prove their routines stayed within spec, and have no defense once a claim is rejected.
Most disputes come down to documentation and discipline. Track every session, respect the stated limits, and both the fleet and its coverage stay protected.
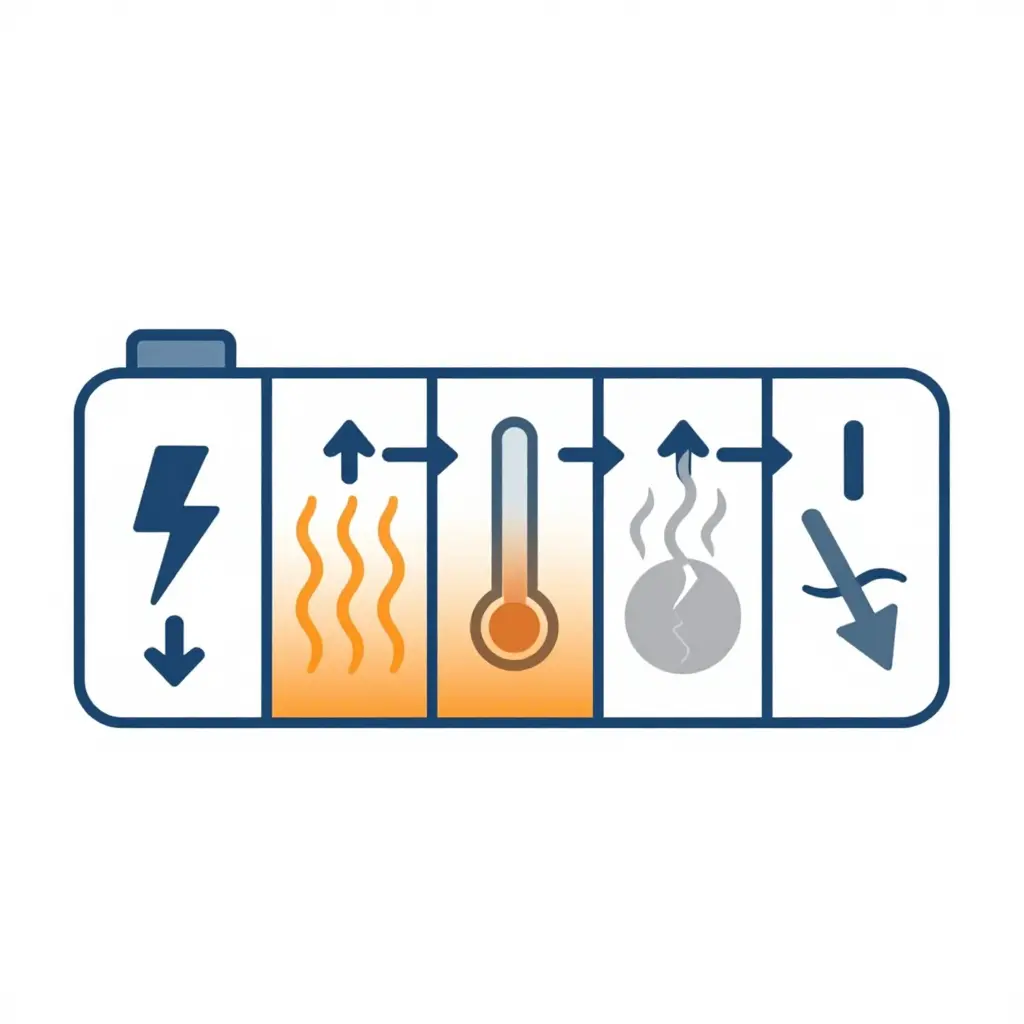
The schematic maps the chain reaction at the center of warranty disputes: high-power charging feeds the pack, that power becomes excess heat, the heat drives swelling and structural strain on the cells, and the accumulated damage shows up as accelerated degradation. It is a simple picture, but it captures the mechanism operators overlook when they treat fast charging as a pure operational convenience rather than a warranty-relevant stress. When batteries age faster than expected, the argument is rarely about whether degradation happened; it is about what caused it, and this flow is where that conversation starts.
When a battery underperforms, the difference between a paid replacement and a rejected warranty claim usually comes down to evidence. Manufacturers rarely act on a verbal report of premature degradation. They ask for a documented history and read it closely.
The Core Evidence Set
A credible claim rests on several records that have to agree with one another:
| Evidence Type | What It Proves |
|---|---|
| Battery management system logs | Voltage, current, cell balance, and fault codes over time |
| Charging data | Session power level, duration, and start/end state of charge |
| State-of-health reports | Periodic capacity and internal resistance measurements |
| Temperature histories | Whether thermal limits were respected |
| Maintenance records | Inspections, repairs, and unauthorized interventions |
| Charging protocol proof | That depot procedures matched manufacturer guidance |
How Fast Charging Appears in the Data
Fast charging leaves a clear fingerprint. Repeated high-power sessions, especially with a hot or nearly full pack, show up as clustered current spikes, elevated cell temperatures, and a steeper state-of-health decline than the baseline curve. The chart below sets a standard overnight profile against a fast-charging one:
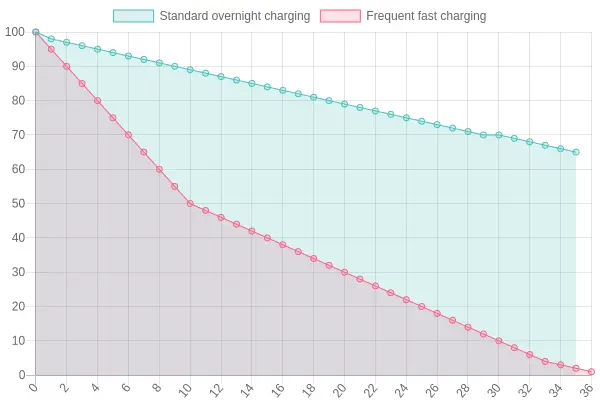
Manufacturers use that pattern to argue the degradation came from operator behavior rather than a manufacturing defect, which shifts responsibility away from the product.
Why Weak Documentation Leads to Rejections
Gaps are fatal. Missing BMS exports, truncated charging logs, or undocumented maintenance create ambiguity, and ambiguity favors the manufacturer. If an operator cannot show adherence to charging protocols, the company can attribute the capacity loss to abuse and deny the claim outright. Complete, exportable records from day one protect the investment, and go best with planning around reliable depot charging infrastructure.
What Actually Drives Battery Warranty Disputes?
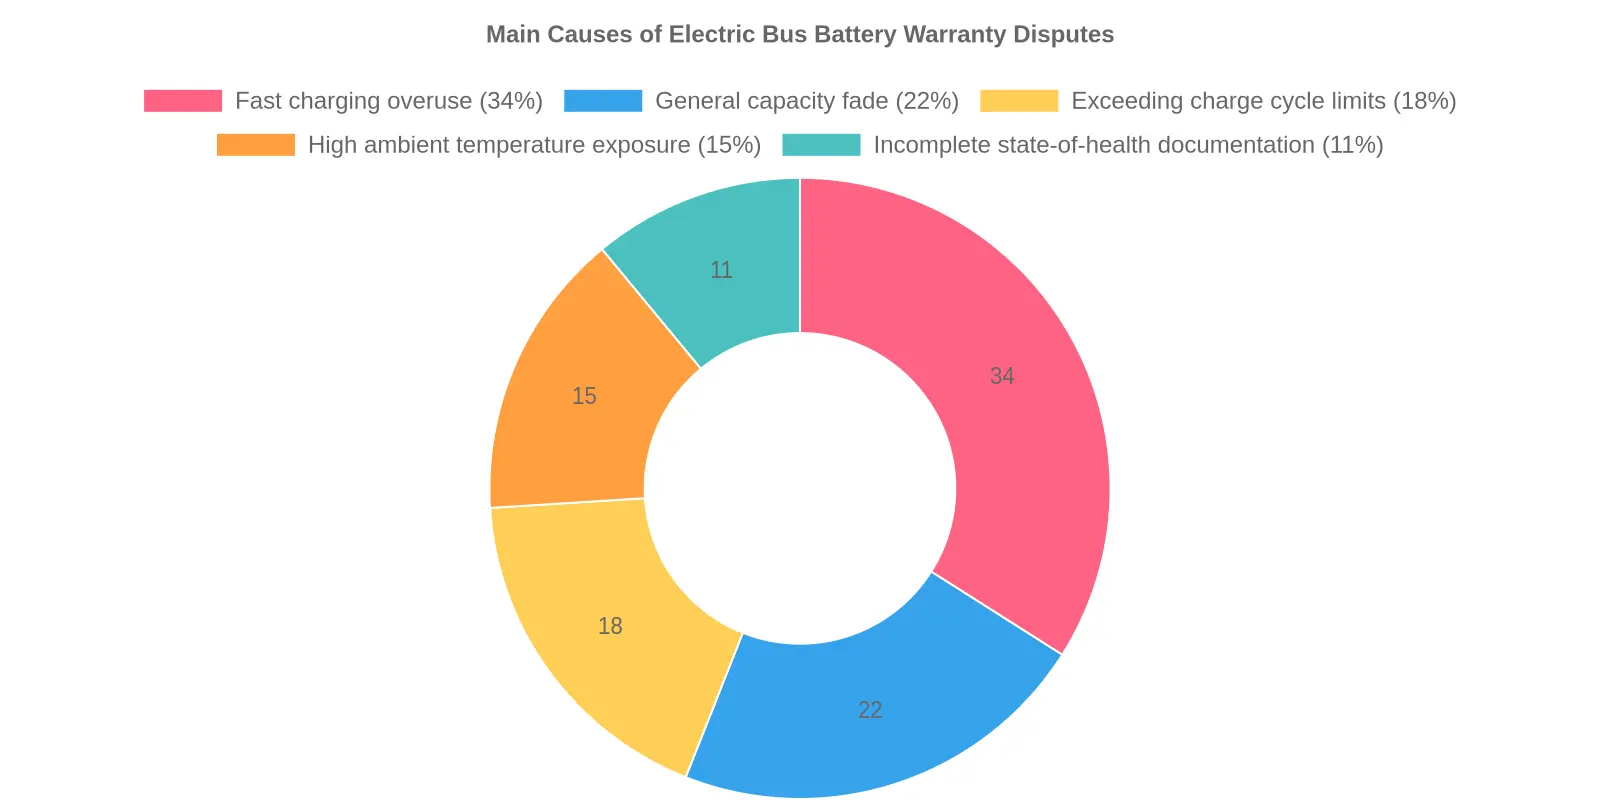
When a fleet says a battery failed early, the argument rarely has a single culprit. The chart breaks down the main causes of electric bus battery warranty disputes by share of cases: fast charging overuse at 34%, general capacity fade at 22%, exceeding charge cycle limits at 18%, high ambient temperature exposure at 15%, and incomplete state-of-health documentation at 11%.
Fast charging overuse is the most contested category because it sits between operator behavior and manufacturer warranty terms. Fleets often adopt opportunity fast charging to keep buses on tight duty cycles, but sustained high-power charging accelerates lithium plating and heat stress, which manufacturers often classify as misuse. The line between “normal operation” and “abuse” is rarely hard, so both sides can point to the same telemetry and disagree about what caused the degradation. That ambiguity, more than any physical failure, turns a routine claim into a dispute. Operators planning charging infrastructure around these risks need to understand grid and depot constraints as well as battery chemistry, which is why many teams review why electric bus fleets stall on depot power upgrades before locking in a strategy.
FAQ: Electric Bus Battery Warranty and Fast Charging
Most fleet operators do not read the warranty fine print until a dispute lands on their desk. These are the questions we hear most often about how fast charging interacts with an electric bus battery warranty.
Does fast charging always void the electric bus battery warranty?
No. Most manufacturers treat fast charging as a normal operating mode, and a single DC session will not void coverage. Trouble usually starts when charging exceeds specified thresholds, for example repeatedly charging above a defined power limit or state of charge for long stretches. Voiding generally requires evidence that abuse, not routine fast charging, caused the failure.
How is normal degradation defined in a battery warranty?
Warranties rarely promise a pack will never lose capacity. They define normal degradation as an expected percentage of loss over a set time or mileage, often as a state-of-health floor (for example, 70 to 80 percent) within a stated period. If capacity drops faster than that curve under compliant usage, the fault may qualify as a warranty defect rather than routine aging.
Can a claim be rejected based on charging logs?
Yes, and this is where most disputes begin. Battery management systems and charger records capture current, voltage, temperature, and session frequency, so an operator can reconstruct exactly how a pack was treated. Manufacturers may reject a claim when those logs show charging outside approved parameters or signs of overheating. Accurate, complete records cut both ways.
How long does a warranty claim take to resolve?
Timelines vary widely. A straightforward claim with clean data often resolves in a few weeks, from initial diagnosis through a state-of-health test and decision. Complex cases with disputed logs or third-party testing can stretch to several months. Operators who submit logged data up front usually shorten the process. Upgrading depot infrastructure for depot power upgrades for electric bus fleets can also cut the charging stress that fuels these disputes.
What charging habits help preserve warranty coverage?
Where schedules allow, favor overnight AC charging, avoid frequent charging to a full 100 percent state of charge, and let packs cool before a DC session. All three reduce wear and keep charging inside typical limits. Keeping buses within the manufacturer’s recommended operating temperature range matters too, and documenting these habits creates a defensible record if a future claim is questioned.
Quick reference
| Concern | Practical takeaway |
|---|---|
| Fast charging | Allowed when it stays within specified power and temperature limits |
| Normal degradation | Defined as expected capacity loss over time or mileage, not zero loss |
| Charging logs | Can support or sink a claim, depending on the recorded patterns |
| Claim timeline | Weeks for clean claims, months when data is disputed |
| Best habits | AC charging, moderate state of charge, thermal management |