


Pumper Tanker for Sale: Why Fill Rate, Not Tank Size, Decides Rural Water Shuttle Speed
Ask a rural fire department what it wants in a pumper tanker for sale and the first number mentioned is almost always tank capacity. That is the wrong number to lead with. On a rural water shuttle, delivered water depends on how fast the apparatus takes water on at the source, not on how many gallons the tank holds.
A bigger tank does carry more on a single dump, but that is the only thing it controls. Fill rate – how quickly the apparatus draws water at the source – sets the tempo of the whole operation. Spec the largest tank available and you add weight and fill time to every trip: the rig holds more, fills slower, and completes fewer round trips per hour.
A mid-size tanker with a fast fill can therefore out-deliver a much larger rig with a slow one. The minutes spent at the fill site, not the gallons in the tank, are what limit the shuttle.
The math below shows where that difference comes from, and what to put in writing when you spec water-shuttle apparatus.
Tank Size vs. Shuttle Speed: A Buyer’s Reality Check
Two pumper tankers can share a 3,000-gallon tank and still turn in very different shuttle numbers. The table puts the spec buyers weigh first – tank size – next to the numbers that decide delivered water per hour: fill rate, dump rate, and cycle time. Use it for a side-by-side read: compare municipal apparatus built for fast fill and dump cycles.
| Tank Size (gal) | Fill Rate (gpm) | Dump Rate (gpm) | Cycle Time (min) | Delivered Water (gal/hr) |
|---|---|---|---|---|
| 2,000 | 1,000 | 1,500 | ~6 | 20,000 |
| 3,000 | 500 | 1,500 | ~14 | 12,800 |
| 3,500 | 1,000 | 2,000 | ~9 | 23,300 |
| 2,500 | 250 | 1,000 | ~18 | 8,300 |
Row one carries 1,000 fewer gallons than row two and still delivers about 56% more water per hour. The 3,500-gallon rig in row three comes out ahead only because it fills at 1,000 GPM and dumps at 2,000 GPM, which holds its cycle near nine minutes.
The Shuttle Loop: Fill, Haul, Dump, Repeat
A water shuttle is a loop: fill at the source, haul to the fireground, dump, return, repeat until the fire is out. Time spent in any one of those four stages is time the fireground spends without water, which is why small cuts in fill and dump time show up quickly in delivered flow.
Fill Rate Fundamentals: Pump, Intake, and Source
How fast a pumper tanker refills comes down to four parts: pump capacity, intake configuration, hose size, and the flow the fill site can actually supply. The slowest of the four sets the refill rate, so improving one without the others rarely changes the clock.
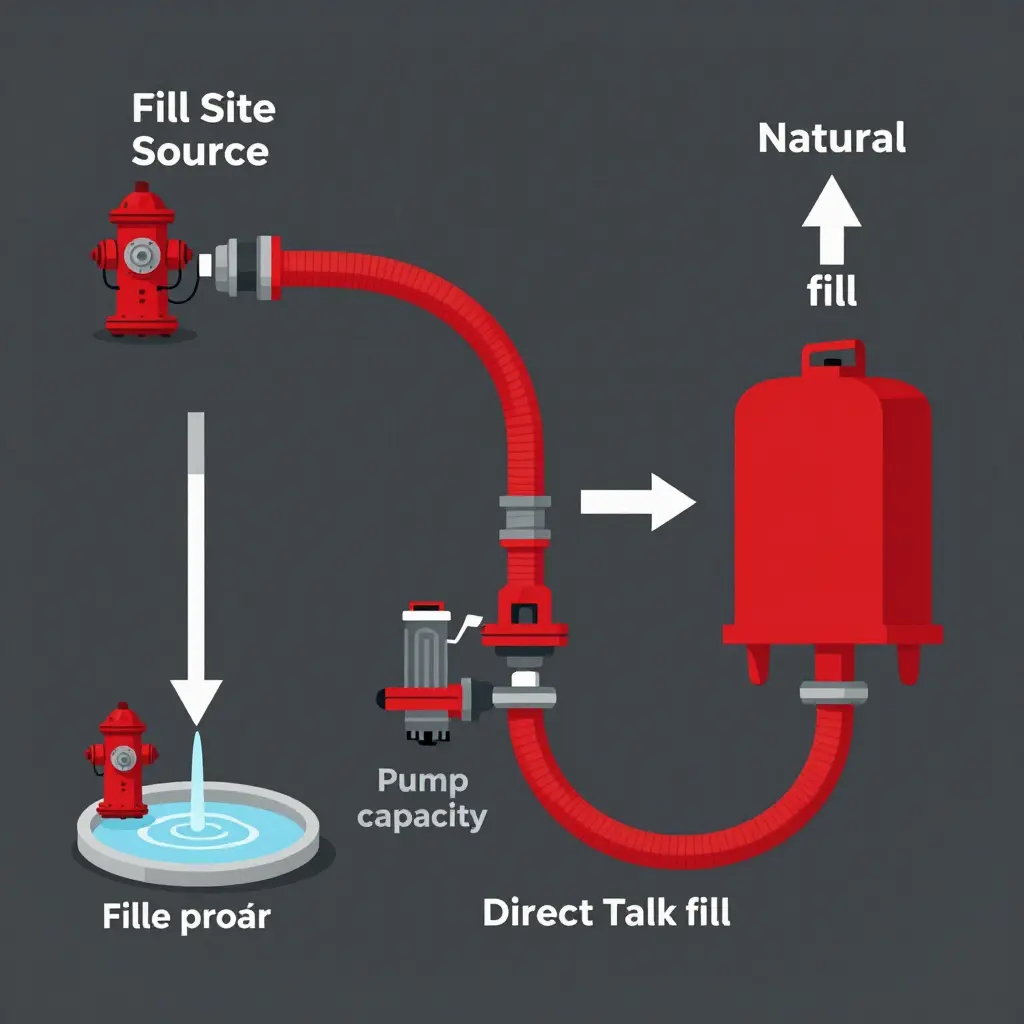
Pump capacity sets the ceiling on gallons per minute into the tank. A 500 GPM pump will not reliably deliver more than 500 GPM, whatever the tank size.
Intake configuration decides how much of that capacity reaches the tank. A large direct tank fill and multiple large intakes keep friction loss low and let the pump run near its rating; a single small port becomes the bottleneck.
Hose size governs friction loss. Larger-diameter hose carries more water with less resistance, so a 4-inch line outflows a 2.5-inch line at the same pressure.
Source flow is the last limit. A hydrant, draft site, or nurse tanker can only give what it can give, and a high-capacity tanker on a weak source simply waits.
The core relationship is inverse: minutes per fill = tank gallons ÷ fill rate (GPM). Double the fill rate and fill time halves; double the tank capacity and fill time doubles.
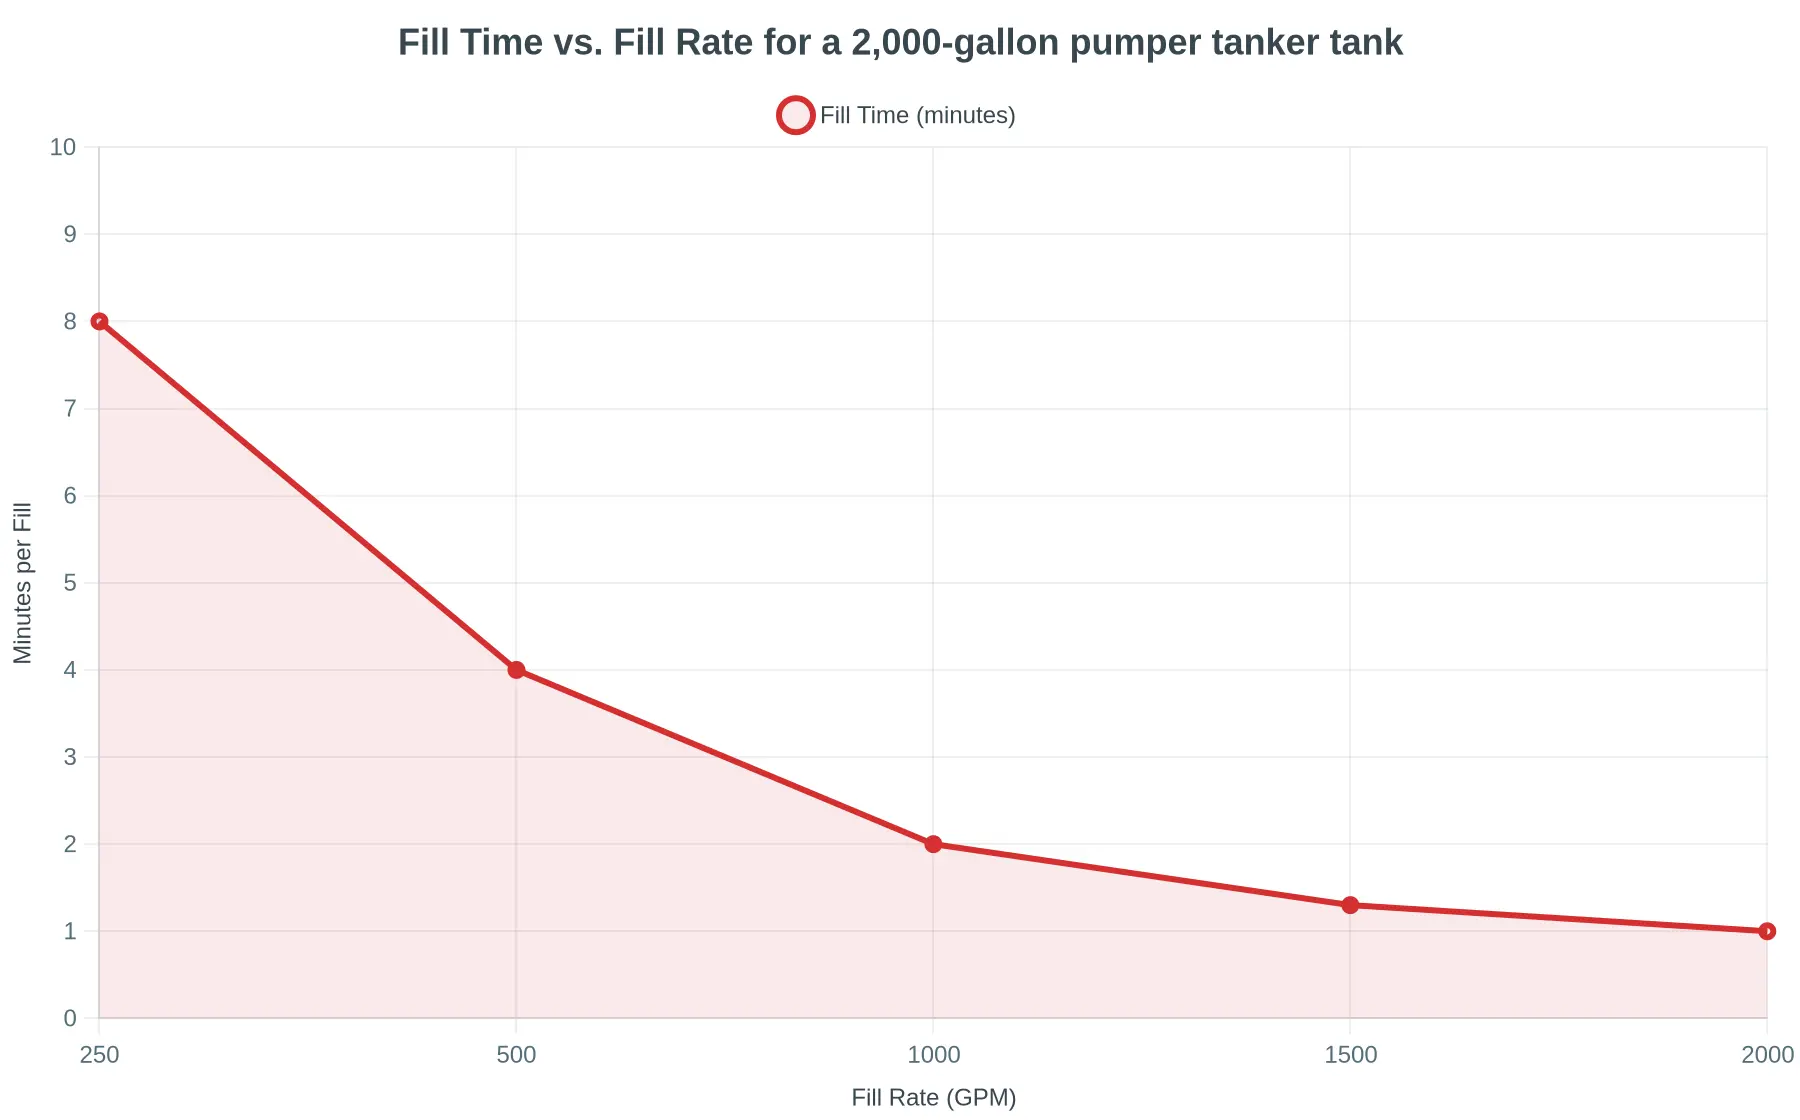
That is why raising fill rate wins. A 2,000-gallon tanker filling at 500 GPM takes about 4 minutes. Add 1,000 gallons of tank and you carry 3,000 gallons at 500 GPM – roughly 6 minutes of fill, plus extra weight on every trip. Double the fill rate to 1,000 GPM instead and the same 2,000-gallon tank fills in about 2 minutes. Shorter fills cut total cycle time (travel out + fill + dump + travel back) on every run, and the savings accumulate across an incident.
What Fill Rate Does to Fill Time
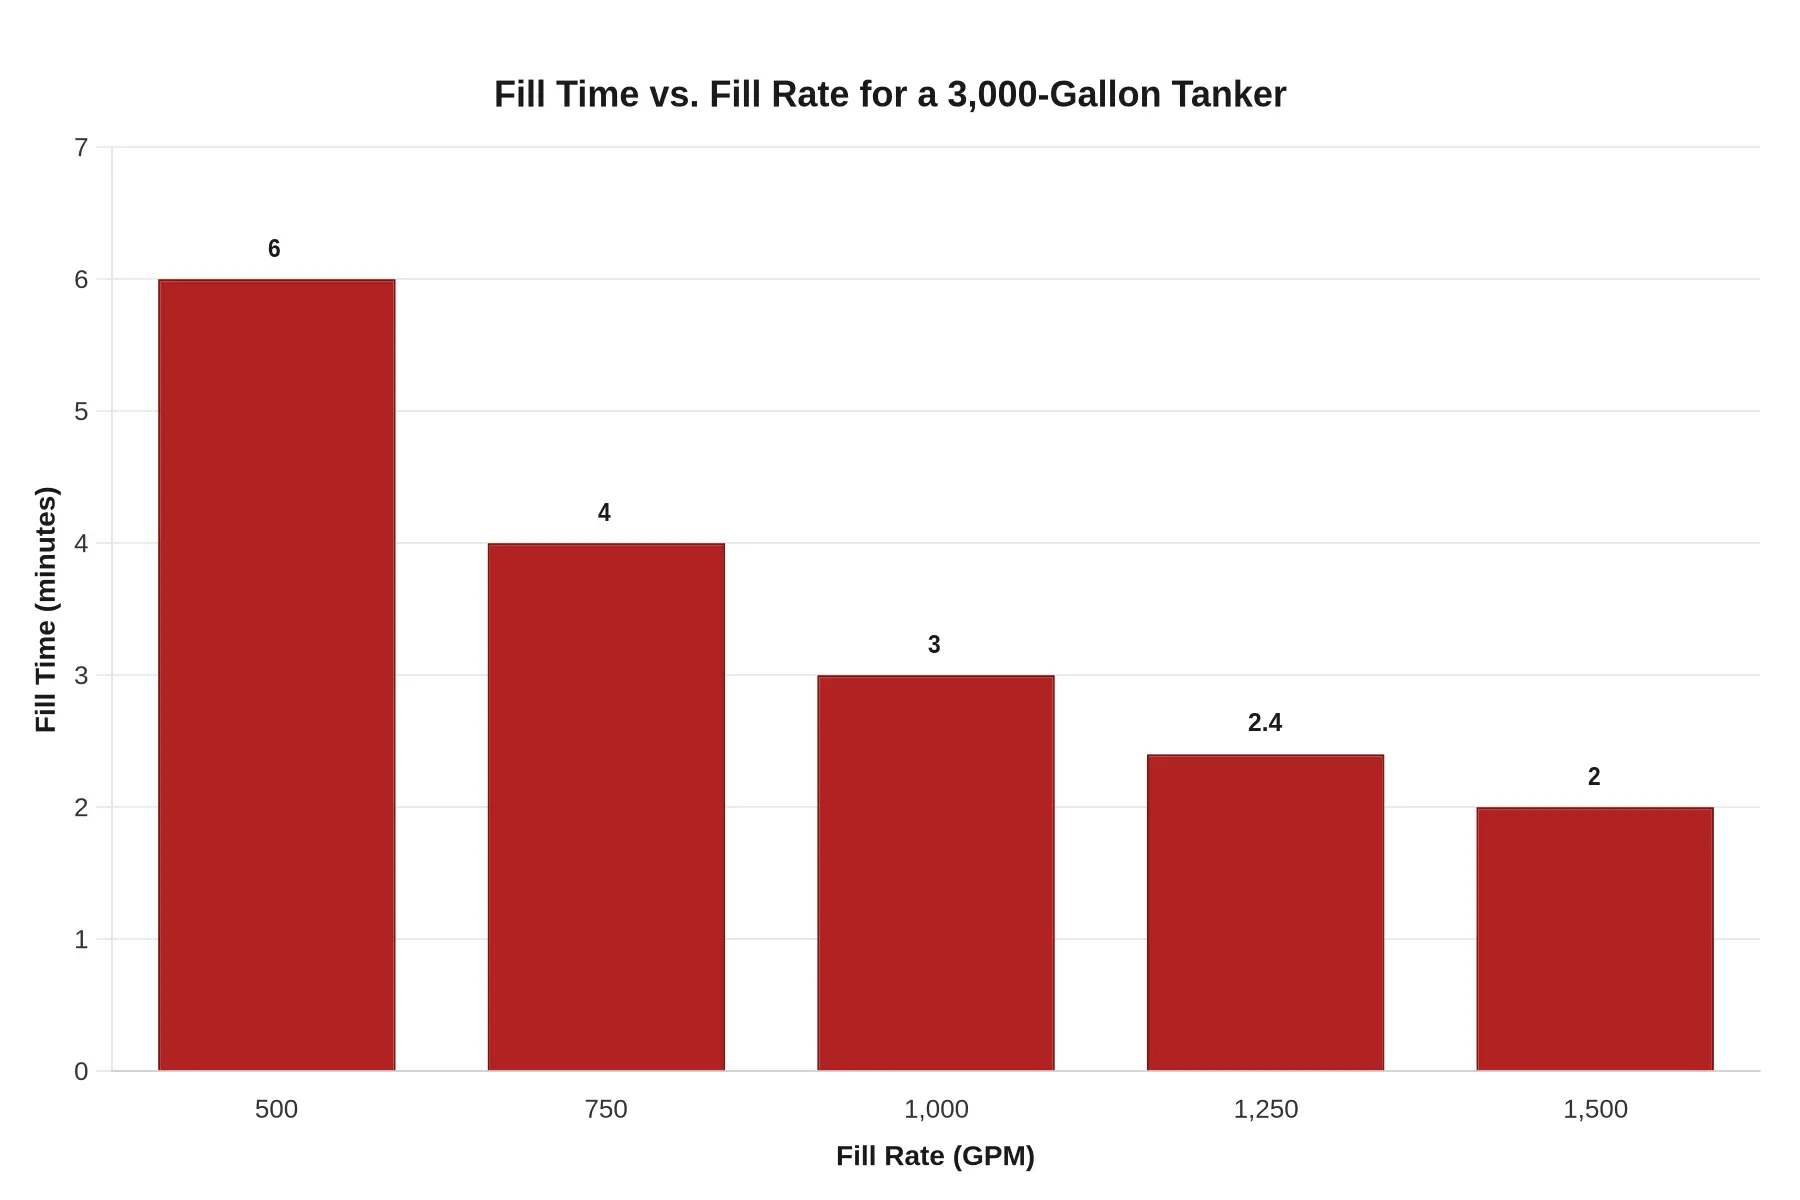
Hold the tank at a representative 3,000 gallons and fill rate alone decides how long the rig sits at the source. The bars cover five fill rates from 500 GPM to 1,500 GPM. Doubling the rate halves fill time; tripling it cuts the wait to a third.
Of the four stages in the loop, the fill site is where a slow tanker loses the most time, so it is where a spec change pays off first. Fewer minutes at the fill stand means more round trips per hour, and more round trips per hour means more gallons per minute on the fire.
When you are comparing a pumper tanker for sale, ask about fill rate first, and treat the answer as a headline spec rather than a footnote.
Reading the Numbers
Same 3,000-gallon tank, three fill rates:
- At 500 GPM, a 3,000-gallon fill takes 6.0 minutes.
- At 1,000 GPM, it drops to 3.0 minutes – a 50% reduction in fill time.
- At 1,500 GPM, the tank is full in 2.0 minutes, a 67% cut against the slowest rate.
For a rural department, the practical result is that a smaller tanker with a fast fill system routinely out-delivers a bigger one with a slow fill. Tank size is easy to read on a spec sheet; fill rate is what moves water.
Procurement Checklist: Questions That Reveal True Shuttle Speed
The numbers that separate two similar-looking tankers are the ones dealers rarely volunteer. Ask for them in writing, and ask for measured figures rather than marketing claims.
- State the measured fill rate at a specific flow – gallons per minute at a named hydrant or nurse connection.
- Give the dump rate in gpm with the dump valve fully open and the tank venting correctly.
- Measure total cycle time end to end: fill, travel to the dump site, dump, and return.
- Confirm intake and hose sizing, including the intake valve diameter and the exact hose size used in the test.
- Report the pump rating in gpm at a stated pressure, and say whether the pump is single or two-stage.
- Calculate delivered water per hour from that real cycle time, then compare it across every candidate rig.
Departments reviewing build platforms can also browse municipal vehicle configurations to align chassis and body choices with their water-shuttle mission.
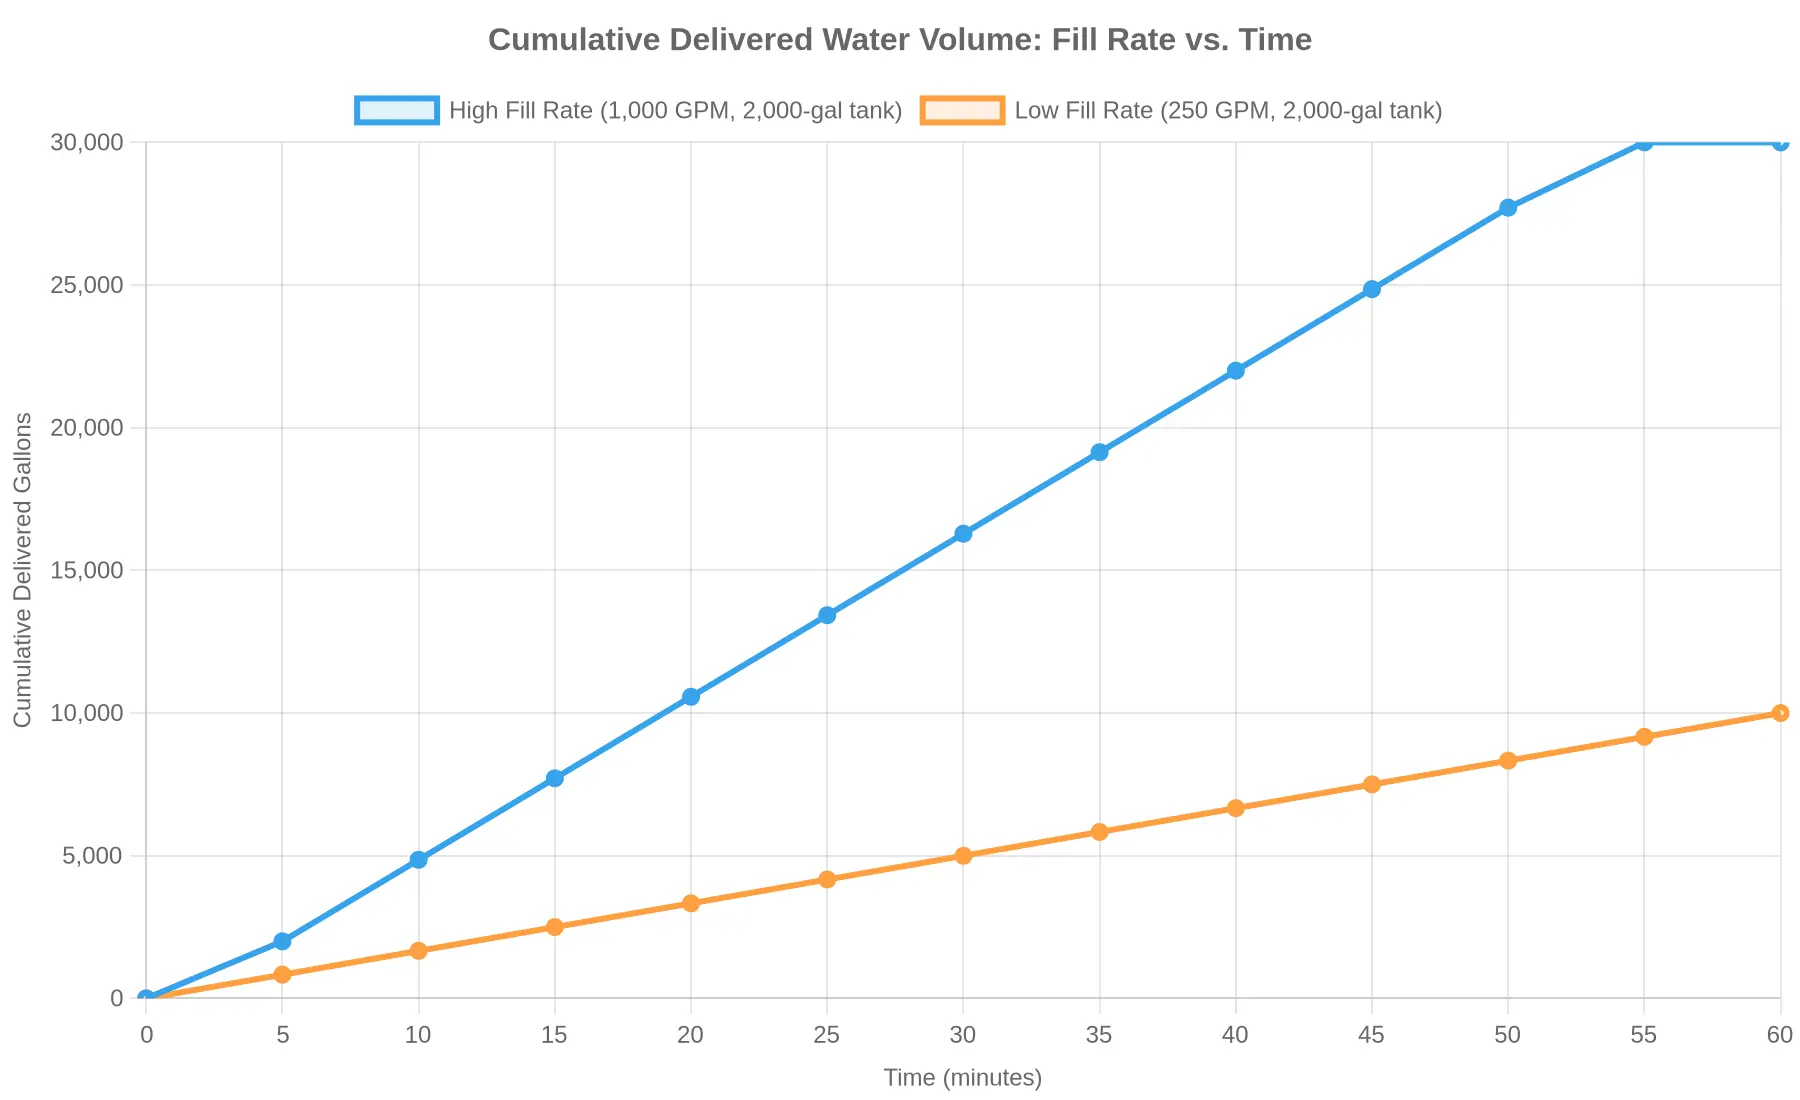
Both tankers in the chart carry the same 2,000-gallon tank, so on paper they look interchangeable. Track cumulative delivered gallons against the clock and tank size drops out of the comparison; fill rate takes over.
What the lines actually show
The steep blue line is the tanker filling at 1,000 GPM. It recharges in roughly two minutes, keeps cycling, and by the 60-minute mark has delivered about 30,000 gallons.
The shallow orange line is the same tank at 250 GPM. An eight-minute fill leaves it parked at the source for longer stretches, and the curve flattens: about 10,000 gallons over the same hour.
What the chart means for rural water shuttle planning
- Same tank, different outcome: identical capacity, roughly a 3-to-1 gap in water delivered.
- Fill rate compounds: the gap widens with every cycle, so a slow rig falls further behind the longer the incident runs.
- ISO and rural water supply credit: faster fill rates support the sustained flow that ISO’s water supply evaluation rewards.
When you evaluate a pumper tanker for sale, ask what it does at the fill site, not just how big the tank is. The tank sets the ceiling; the fill rate decides how fast you reach it.
Frequently Asked Questions About Pumper Tankers and Water Shuttle Speed
Does a bigger tank always mean better shuttle performance?
No. A larger tank can reduce trips, but if the pumper tanker is hard to fill or dump, cycle time stretches. Fill rate and dump rate usually dictate shuttle speed more than raw capacity does.
What fill rate should a department target?
Target a fill rate that matches your fastest available water source. For most rural operations, 1,000 to 1,500 GPM keeps cycle times short and aligns well with common 2,000-gallon pumper tankers.
How do fill rate and dump rate interact?
Together they set total cycle time. A fast fill is wasted behind a slow dump, and the reverse is equally true. Match both to the tank so the tanker spends as little time stationary as possible at either point.
How should you evaluate a pumper tanker for sale using cycle time?
Time a full cycle: fill, travel, dump, and return. Ask the seller for real fill rate and dump rate data, then compare. The pumper tanker for sale with the shortest verified cycle time wins.
How does fill rate affect ISO and rural water supply performance?
ISO credits water shuttle capacity delivered per unit of time, so fill rate directly affects your rating and available fire flow. Faster fill rates improve rural water supply performance regardless of tank size.
Conclusion: Buy for Fill Rate, Not Tank Size
In a rural water shuttle, speed comes from fill rate, dump rate, and cycle time. Tank size matters on the first dump; after that, the shuttle runs on how fast the source refills the tank and how fast the tanker empties at the fireground.
For fire chiefs and procurement committees, that should shape the specification. A large tank with a slow fill connection and a gravity-dependent dump will lose a sustained shuttle to a smaller, faster-cycling unit. Work through pump capacity, intake and discharge plumbing, dump-valve configuration, and expected round-trip time before you compare tank volumes on a spec sheet.
When you evaluate a pumper tanker for sale, run it against your own shuttle model, flow targets, and ISO expectations rather than matching spec sheets. Manufacturers such as CRRC build municipal and specialty apparatus worth measuring against those numbers.
Final recommendation: define the fill rate and dump rate your coverage area actually requires, model the resulting cycle time, then select the tank that supports those numbers. Buy for fill rate – and let tank size follow.