

Why Pump Drive Ratio Decides the Outcome of an FMC Fire Engine Repower
An FMC fire engine repower puts a modern, higher-torque diesel where the original engine sat. The pump, the plumbing and the panel usually stay. Between the two sits a gear set, and its ratio is what turns engine rpm and torque into the pump shaft speed and absorbed power that produce flow and pressure at the nozzle.
- A fixed link between engine and pump. The impeller turns at a set multiple of engine speed. Change the engine’s rpm range and that multiple has to be rechecked, because pump output follows shaft speed, not the torque figure in the sales brochure.
- Modern torque arrives lower and stays longer. A current diesel reaches peak torque around 1,200 rpm and holds it past 1,700. The driveline in an older FMC was sized around a curve that peaked at 1,400 rpm and fell away above it.
- Left alone, the ratio errs in one direction or the other. Too little reduction and the pump over-speeds near governed rpm. Too much and it is under-driven exactly where the new engine makes its best torque, so the extra output never reaches the water.
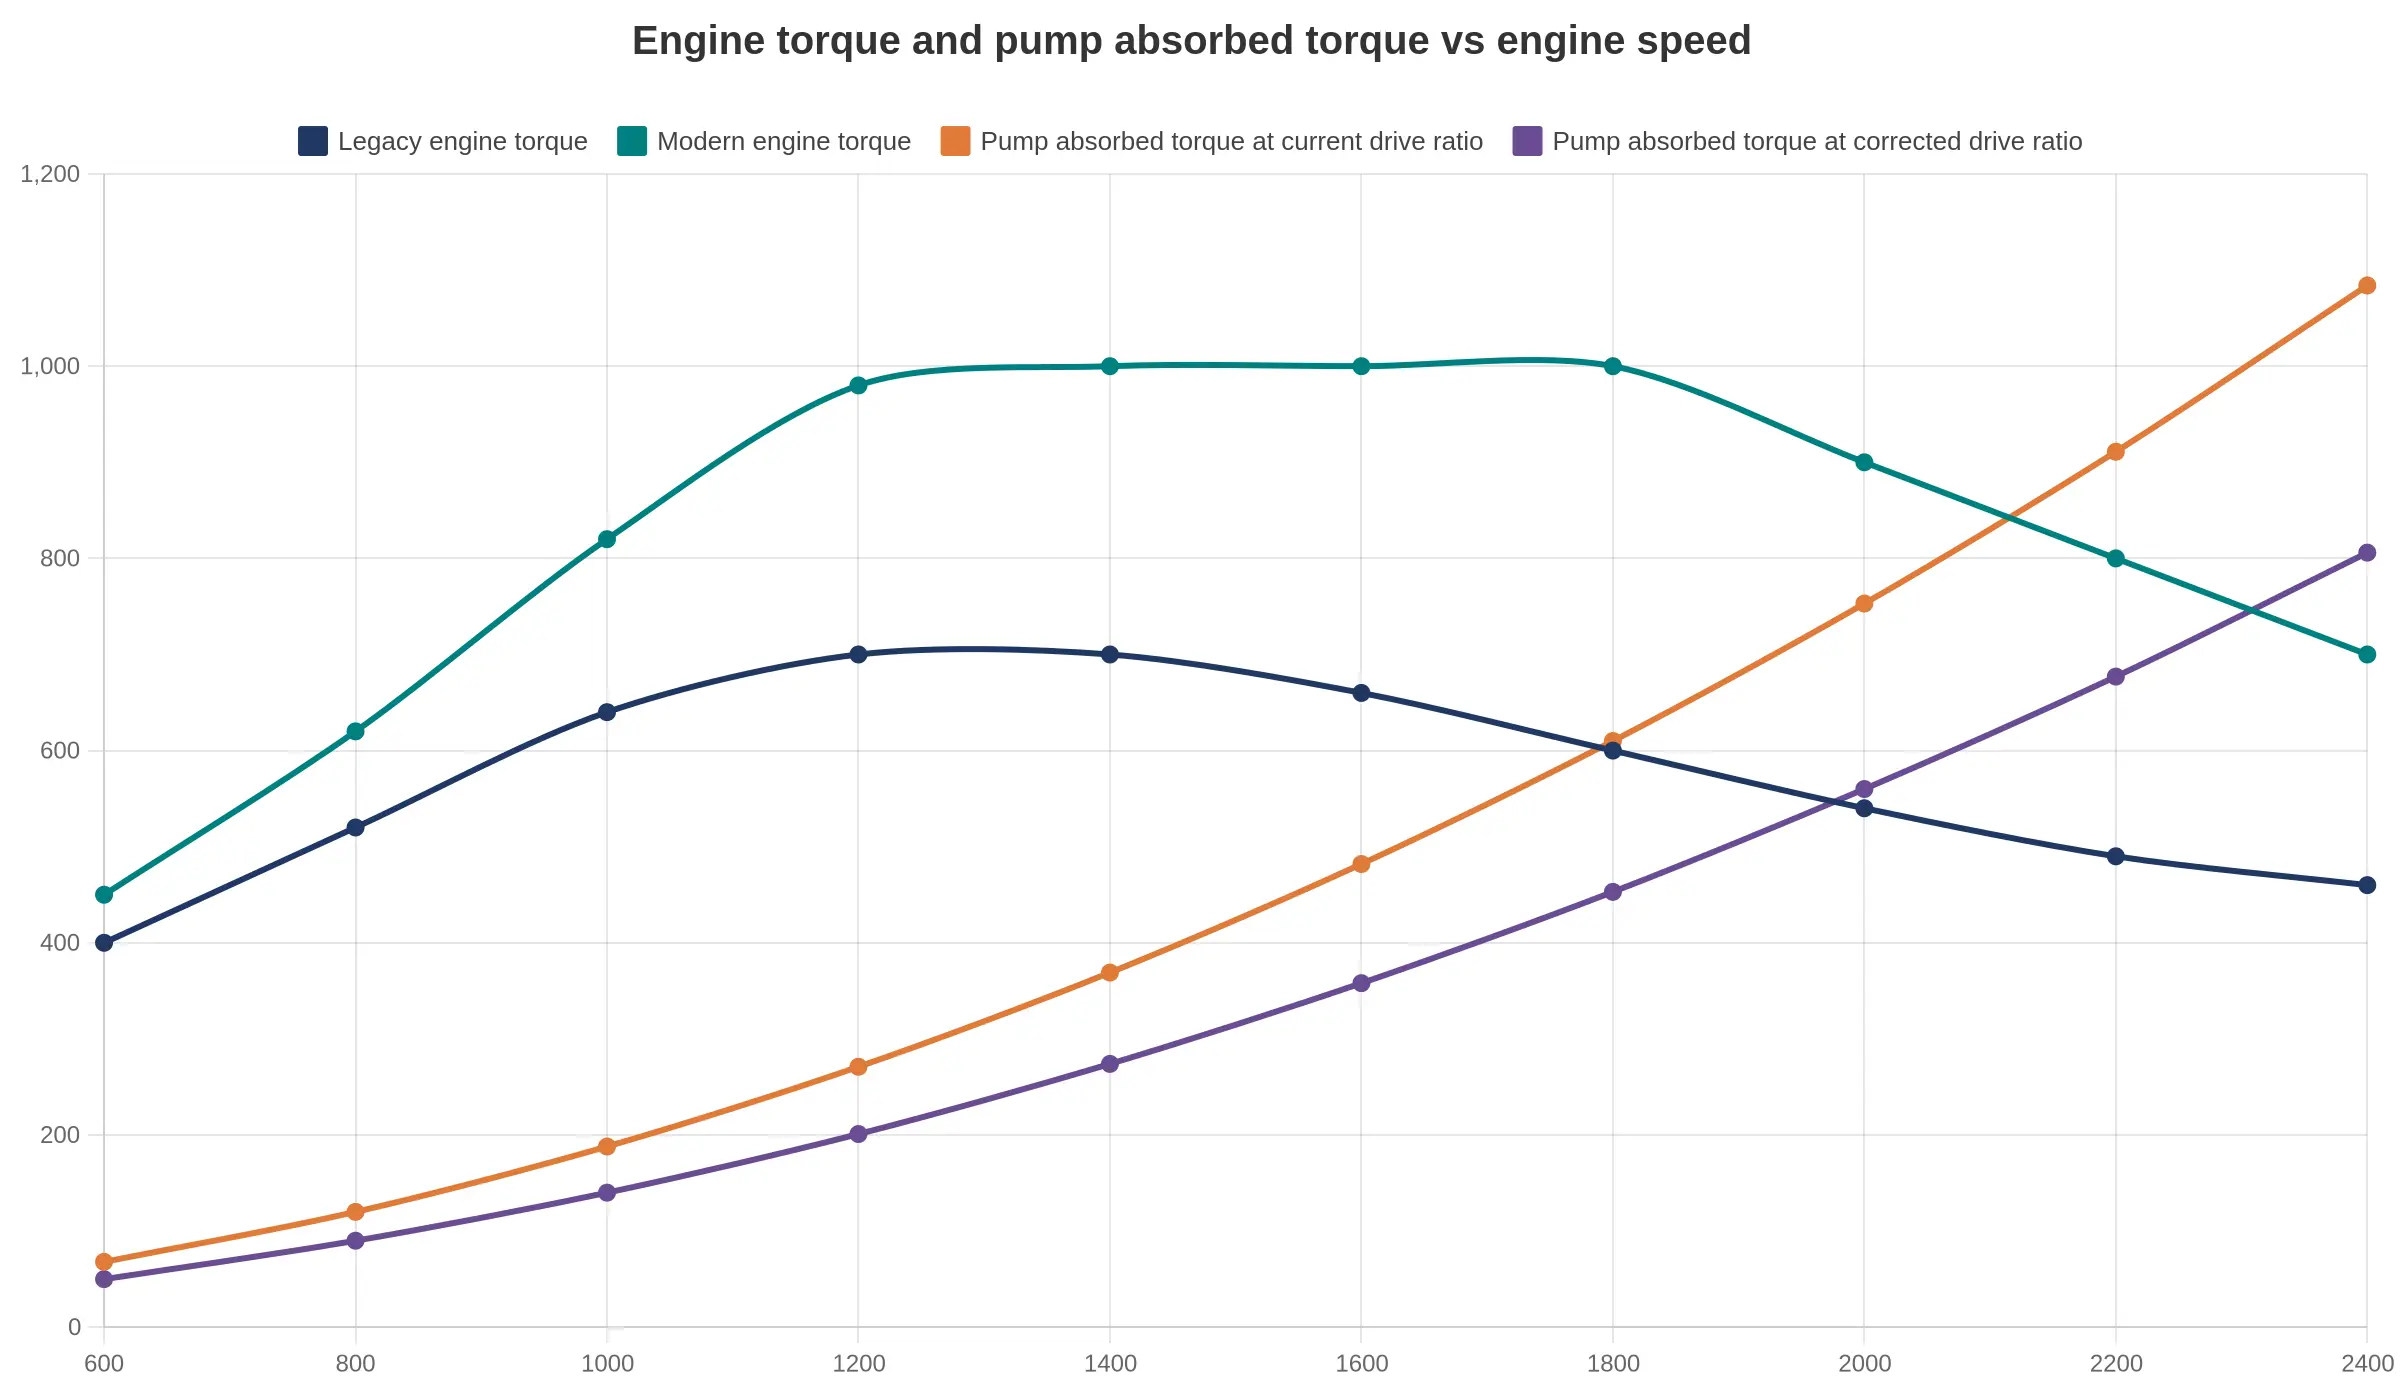
Caption: Pump output settles where the engine torque curve crosses the pump’s absorbed-torque curve. Fit a modern engine that flattens and lowers that curve, leave the drive ratio untouched, and the intersection moves off the intended duty point. The dashed line is the corrected ratio, bringing the crossing back onto the torque plateau, at a higher engine speed.
A Six-Step Method to Match Pump Drive Ratio to Modern Engine Torque
Repowering with a modern diesel changes almost everything downstream of the flywheel, including how fast the pump spins at any given throttle position. The six steps below keep that transition predictable, whether the truck is a new build on a municipal chassis or an older apparatus going back into front-line service. Each step feeds the next, so work them in order.
- Collect the pump’s rated speed, rated pressure and rated flow. These three numbers define what the pump has to deliver and they anchor every calculation that follows. Copy them exactly as published, footnotes about intermittent duty included.
- Record the new engine’s governed rpm and the rpm at peak torque. Take both from the published torque curve rather than from memory, and note where torque falls away near the top of the band.
- Work out the pump shaft speed that rated performance needs. Start from the rated pump speed, then check the manufacturer’s performance curve at your target pressure to see what the impeller actually needs to reach rated flow.
- Build one ratio for the whole chain. Multiply the PTO ratio by any driveline or gearbox step, so you end up with a single engine-to-pump figure instead of three numbers that nobody reconciles.
- Test that figure across the full engine band. Low idle, peak torque and governed speed each need checking. A ratio that looks right at rated rpm can over-speed the pump at high idle and starve it at the bottom of the range.
- Write it down and have it confirmed. A one-page summary listing inputs, the derived ratio and the resulting operating envelope gives the pump and engine suppliers something specific to sign, and gives the next technician something to work from when a warranty question comes up.
Repower Interface Comparison: Legacy Engine vs Modern Engine
The table collects the values that have to be reconciled before hardware is ordered. Treat the figures as an example of the format; the ones for your truck come off its own data sheets.
| Parameter | Legacy Engine Setup | Modern Engine Setup | Target After Repower |
|---|---|---|---|
| Rated torque | 1,050 N-m at 1,400 rpm (mechanical injection, fixed timing) | 1,600 N-m across 1,200-1,700 rpm | At least 1,500 N-m available continuously at the pump duty point |
| rpm at peak torque | 1,400 rpm | 1,200-1,700 rpm (flat torque band) | Peak torque band must cover the pump rated speed after reduction |
| Governed rpm | 2,600 rpm (mechanical governor) | 2,200 rpm (electronically governed, adjustable) | 2,200 rpm, with PTO engagement interlock on the governor |
| Torque rise across the working band | 12-18 percent from peak torque to governed speed | 25-35 percent, depending on rating | At least 20 percent, so pump pressure spikes do not pull the engine down |
| PTO or driveline reduction ratio | About 1.50:1 through the original pump transmission | 1.24:1 step-down under evaluation | To be confirmed from the supplier data sheet once the pump curve is fixed |
| Pump shaft speed at governed rpm | 1,730 rpm (2,600 divided by 1.50) | 1,775 rpm (2,200 divided by 1.24) | 1,750-1,800 rpm, matching the pump nameplate rating |
| Pump absorbed power at rated pressure and flow | About 90 kW at 1.0 MPa and 4,000 L/min (67 kW hydraulic, 75 percent pump efficiency) | About 90 kW, unchanged hydraulic duty | About 90 kW at the same pressure and flow, so the pump rating is preserved |
| Allowable pump speed tolerance | Plus or minus 5 percent, mechanical governor droop | Plus or minus 2 percent, closed-loop electronic control | Plus or minus 2 percent at the pump shaft |
| PTO torque capacity (continuous) | 1,050 N-m, matching engine rated torque | 1,600 N-m peak, derated to 1,350 N-m continuous | At least 1,300 N-m continuous with a cooling check on the PTO clutch |
| Engine speed and control interface | Mechanical cable and linkage to the pump shift | J1939 CAN network, with configurable throttle and safety inputs | J1939 interface with pump engage logic and neutral interlocks wired to the body controller |
Ten rows, three kinds of limit. The first four describe what the engine can deliver. The next three describe what actually reaches the pump shaft. The last three describe how the two stay inside their ratings in service. Only the ratio is genuinely free to change; the rest is fixed by the engine rating, the pump nameplate or the PTO hardware, which is why that one row still carries the “to be confirmed from supplier data sheet” note until the pump curve and the new engine rating are both signed off.
Fleets running mixed municipal apparatus usually compare these values across two or three chassis before committing, since PTO architecture differs by builder. The municipal vehicle platforms section shows how production units lay out the pump and body interfaces.
How a Drive Ratio Mismatch Shows Up in Service
A mismatch between engine torque and pump input speed seldom produces one dramatic failure. It shows up as a cluster of complaints that each look like a separate fault: pressures that drift, flows that fall short, hardware that wears faster than the service interval assumes. Technicians chase the pump, the relief valve and the PTO one at a time, and the ratio gets checked last, if at all.
- Over-speed and cavitation. A ratio that spins the shaft past the pump’s rated speed sends the impeller faster than the inlet can supply water. Local pressure drops below vapor pressure, bubbles form and collapse against the volute, and the impeller erodes from the inside.
- Relief valve held open at working speed. Too little reduction lets the pump reach its rated pressure at part throttle and keep climbing as rpm rises. The relief valve lifts early and stays open, the pump heats its own water, and the panel setting stops meaning much.
- Rated flow short at the relief setting. Too much reduction leaves the pump turning too slowly, so the unit settles below its rated flow curve at exactly the net pressure the relief valve holds.
- Driveline and PTO overload. Transmitted torque scales with the ratio, and shafts, yokes and PTO gears were sized for the original engine’s rating.
- Wear in seals and bearings. Shaft speed above the design point raises heat and radial load at the seal chamber and bearings, and the vibration of an over-driven or misaligned driveline speeds the process up. Cavitation damage, repeated over-pressure cycles and a relief valve held open use up the pump’s design margin years before the overhaul window.
For a fleet the cost lands in three places. A front-line engine is out of service for days to a few weeks once parts and shop slots are counted, and a reserve unit covers the gap or the district leans on mutual aid. Warranty claims stall because they sit across the driveline: the engine OEM and the pump OEM each point at the other’s operating envelope, and resolving that can take months. Then comes the second round of labour, reworking the driveline and PTO interface, recalibrating the governor, and re-documenting the ratio, torque curve and relief settings, none of which was in the original estimate. Reviewing compatible municipal fire apparatus platforms before the swap is cheaper than correcting one afterwards.
A ratio audit before the engine goes in, comparing torque at the pump’s rated input speed rather than at peak torque, is usually the difference between a single-pass repower and an open-ended troubleshooting cycle.
Reading the Diagram
The drawing answers one question quickly: where does the ratio get applied? Torque leaves the engine block on the left, passes through the clutch or torque converter and enters the transmission. There the path splits. One branch runs rearward to the axle, so the truck still drives. The other rises through the PTO take-off and follows the driveline shaft to the gear-pair icon, which is the ratio stage, the point where engine speed is traded for pump speed. Everything past it is the pump itself.
The parallel take-off explains why pump performance depends on the ratio in the pump branch and not on the axle ratio or tire size. On a repower it is usually the only place a correction is needed, which is why a truck built on a municipal-grade chassis can keep its existing pump and plumbing.
What to Specify and Document Before Ordering Parts
Once the ratio is agreed, the risk moves from engineering to procurement. The parts that blow a repower budget are rarely the big ones; they are the ones ordered without paperwork behind them. Four documents carry most of that load, and each needs an owner before the PO goes out.
1. Data sheets from the pump and engine suppliers
Ask for the full performance curve, not a single rated point. The engine supplier owes you the torque curve at governed speed with accessory loads already deducted: fan, alternator, compressor, air conditioning. The pump supplier owes you the absorbed-power curve, the rated-speed tolerance and the maximum intermittent rpm. Collecting both and checking that the revision dates match the hardware on the vehicle is your job; the accuracy of what they issue is theirs.
2. The calculation record kept in the vehicle file
Keep a one- or two-page calculation, signed and dated, showing inputs (engine torque, driven gear ratio, pump absorbed power, driveline efficiency), the assumptions, the resulting ratio and who reviewed it. A supplier will run the numbers for you, but the record belongs with the vehicle, so the next owner, inspector or repair shop can see why the ratio was chosen. In practice FMC documentation is often thin on exactly this point.
3. Interface points to confirm with the driveline and PTO supplier
Confirm in writing before release: SAE flange size, pilot diameter and bolt circle, shaft spline and length, PTO output speed and torque rating, mounting pad position, clearance to frame and crossmembers, oil flow and cooling, and the wiring for PTO engagement and safety interlocks. That these match the chassis is your confirmation; the specification of the parts themselves is the supplier’s.
4. Acceptance criteria written into the purchase order
Put measurable criteria in the PO itself: pump flow at rated pressure, engine speed held at governed rpm under load, no derate or fault codes, temperature stability after a defined run, vibration and noise limits, and the documentation deliverables. You write them, the supplier accepts them. Fleets working with municipal vehicle platforms or with liquid waste and pump-equipped tanker bodies can reference the body builder’s baseline figures here instead of renegotiating them unit by unit.
| Item | Buyer owns | Supplier owns |
|---|---|---|
| Data sheets | Collecting, checking revisions | Accuracy of issued curves |
| Calculation record | Filing with the vehicle | Running the numbers if asked |
| Interface points | Confirming fit to chassis | Specifying their own parts |
| Acceptance criteria | Writing and enforcing | Accepting and meeting them |
Settling these four items before the PO goes out is cheaper than settling them after the pump is bolted in.
Where a Fire Engine Repower Budget Actually Goes
Hardware is easy to quote. Interface work is not, and it is where a scope signed off in good faith starts to move. The split below is a set of planning ranges for a full pump-drive and powertrain repower, useful mainly for sanity-checking the quotes you already have.
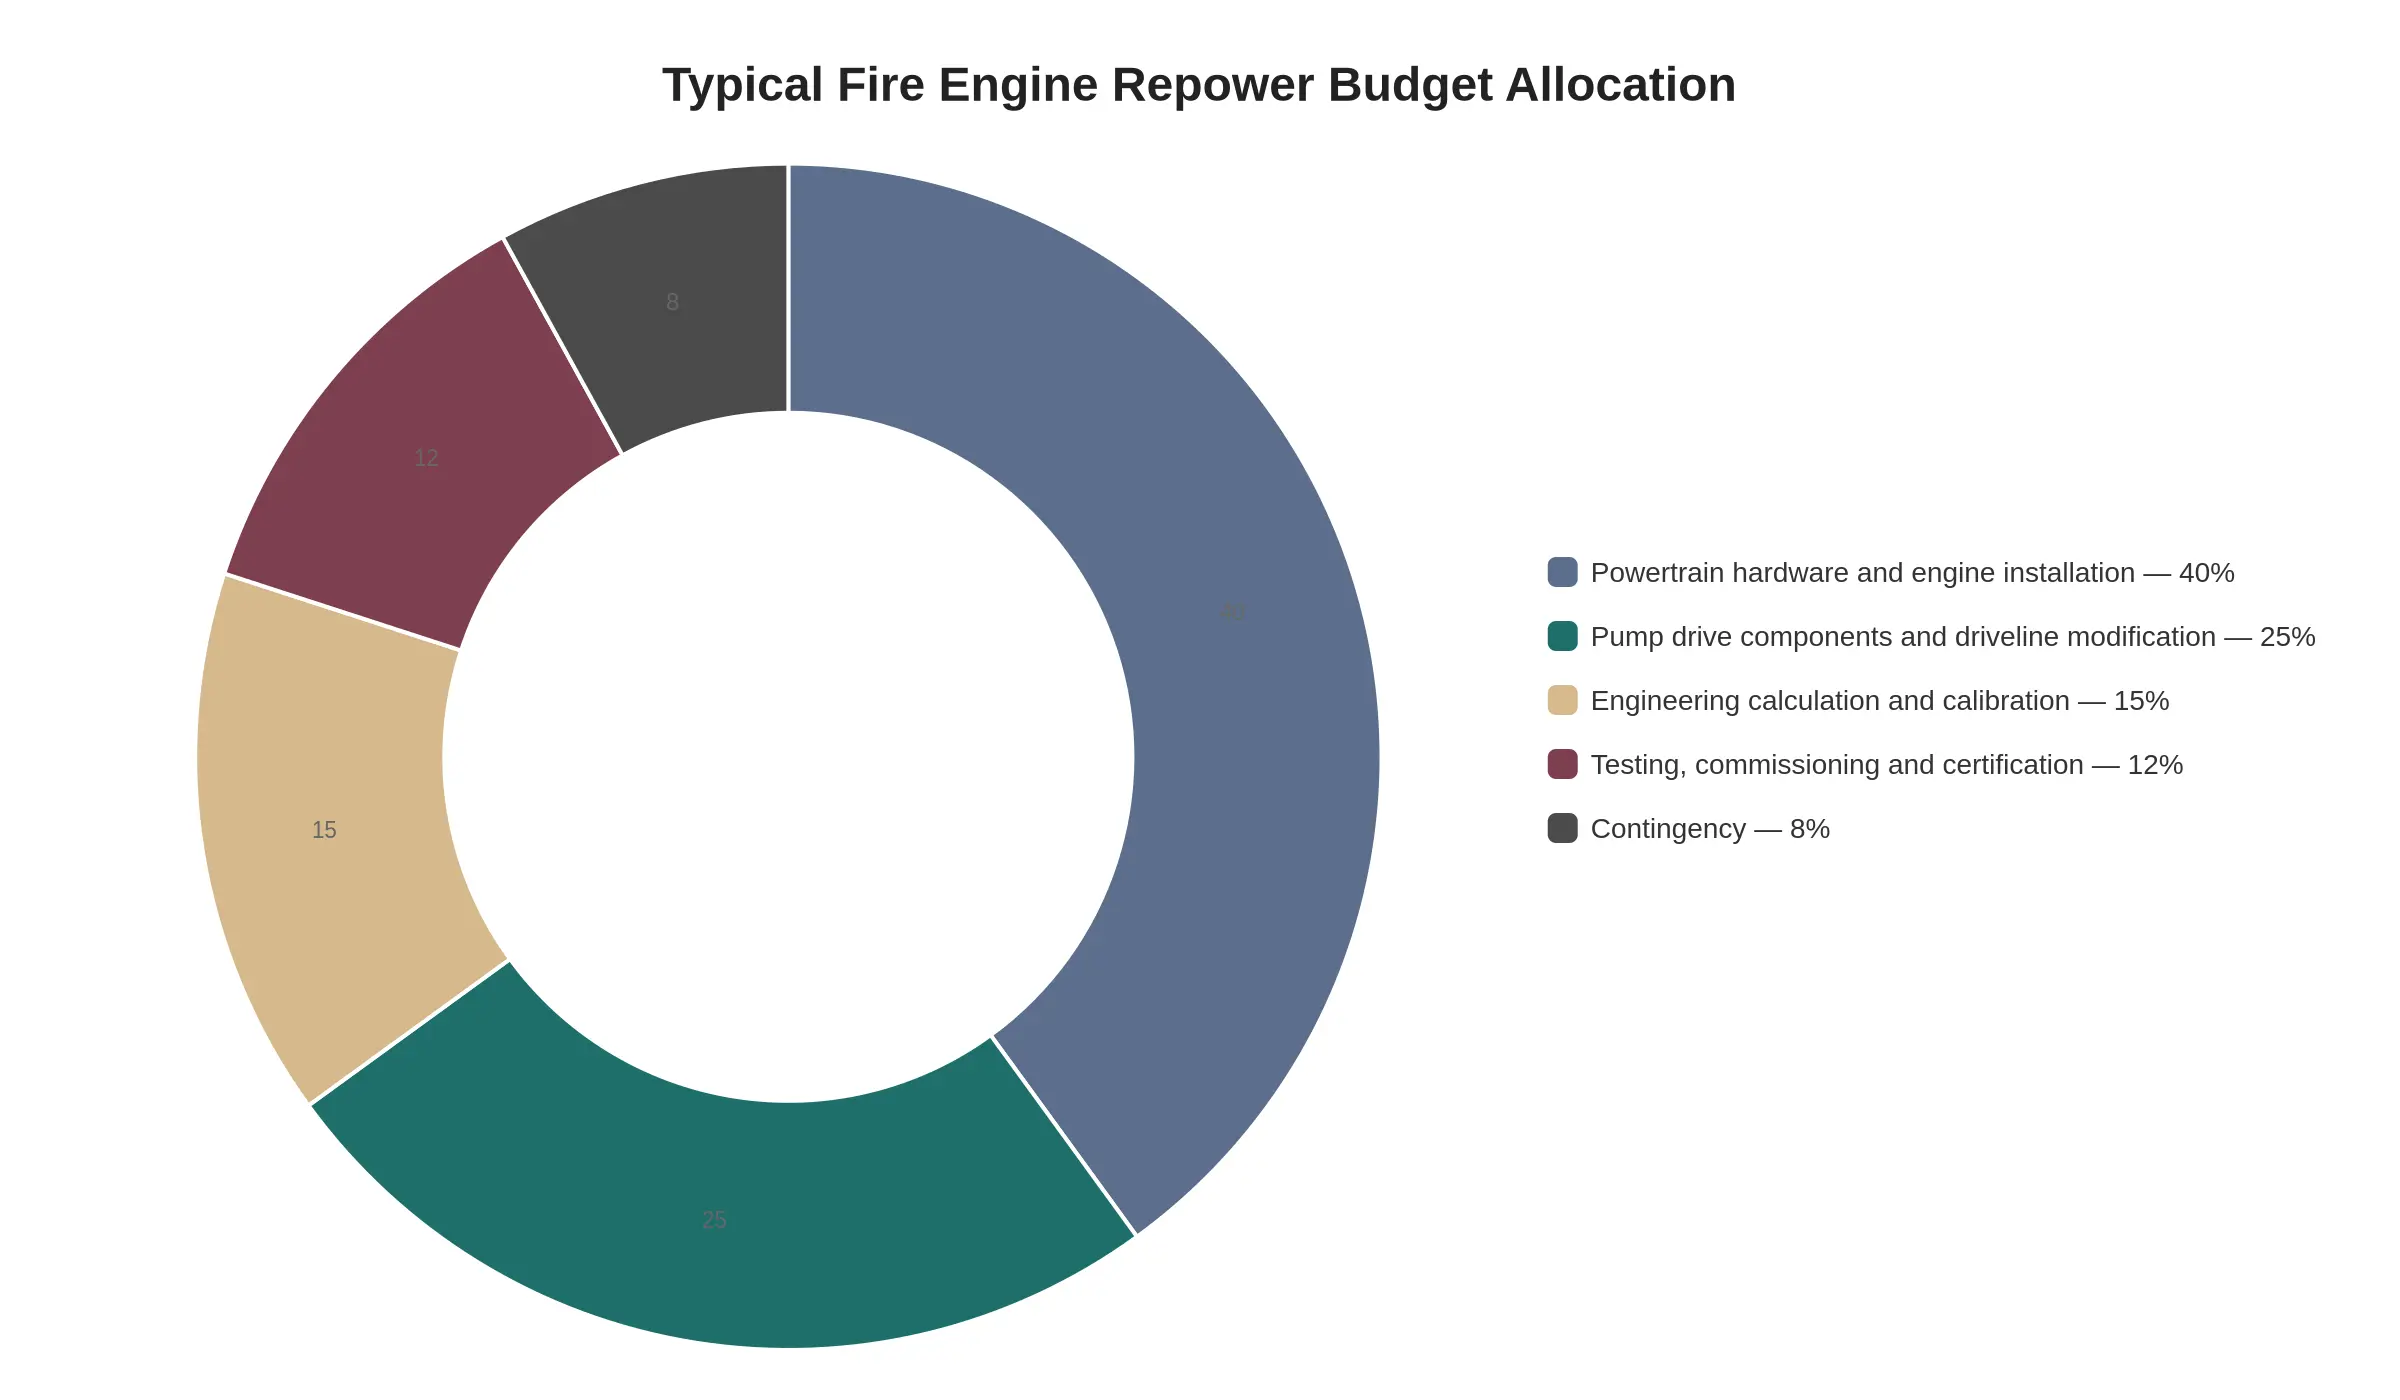
Treat the percentages as indicative planning ranges rather than fixed prices.
- Powertrain hardware and engine installation – 40% (range 35-45%): the new engine, mounts, cooling package, exhaust aftertreatment, wiring, and the labour to hang it all.
- Pump drive components and driveline modification – 25% (range 20-30%): the pump transmission, driveshaft, torsional coupling, and any bell-housing or frame changes needed to match the pump drive ratio to modern engine torque.
- Engineering calculation and calibration – 15% (range 10-15%): torque and torsional analysis, ratio selection, and the calibration work that keeps the pump curve honest.
- Testing, commissioning and certification – 12% (range 8-12%): flow and pressure verification, road and pump testing, and the paperwork the authority having jurisdiction will ask for.
- Contingency – 8% (range 5-10%): the allowance for whatever the inspection turns up once the body is apart.
Caption: Engineering calculation, calibration and commissioning are routinely under-budgeted, which is where a torque-matched pump drive turns into a change order.
If several repowers are planned, it is worth comparing notes with a supplier who builds municipal fleet vehicles around this kind of driveline work, so the split reflects installation experience and not just a parts list.
Testing and Commissioning Checks Before Return to Service
A recalculated pump drive ratio is only a prediction until it is measured under load. Commissioning is where the arithmetic match between modern engine torque and impeller demand becomes evidence, and it is the last gate before the apparatus goes back on the run list.
- Pump performance test at rated pressure and flow. Run a fire pump performance test at the rated duty point and record pressure and flow together. A pump sized for the old curve can end up over-driven or starved at the same throttle position, and a measured curve is the only proof that the apparatus still delivers its nameplate.
- Pump shaft speed at governed engine rpm. Measure pump rpm at governed high idle and divide by engine rpm. That confirms the ratio in the truck matches the one in the repower file, rather than an assumed pulley or gear selection.
- Relief valve and governor settings. Check relief valve cracking pressure and the governor’s high-idle limit. The new engine holds rpm under load where the old one sagged, so discharge pressure climbs faster at part throttle, and the relief valve is what keeps it under the panel setting.
- Driveline alignment and vibration. Inspect alignment and measure vibration through the pump drive with the pump loaded. Different torque delivery changes torsional loading, so a misaligned shaft or a marginal universal joint shows up as vibration before it becomes a failure.
- Cooling and lubrication under sustained pump load. Hold a pumping load and watch coolant temperature, engine oil pressure and transmission fluid condition. Pump duty keeps the engine at high load far longer than road driving does, which exposes cooling or lubrication margins a road test never reaches.
- Measured ratio against the documented calculation. Cross-check the measured ratio with the documented figure and update the unit’s service records, so parts ordering, impeller changes and operator expectations all point at one verified number.
Record values next to each item, not just a tick, so the commissioning sheet becomes the baseline for the next pump test. Fleets standardising several repowered units can review the wider range of municipal vehicle platforms for comparable commissioning practice.
FAQ
Can I keep the existing fire pump when I replace the engine?
Yes, provided it passes a mechanical inspection and the housing, shaft and bearings are within tolerance. Reusing the pump is routine on municipal fleet vehicles. What cannot go unexamined is the PTO, driveshaft and gearbox, which have to be checked against the new engine’s torque curve. If wear has already pulled rated performance down, replace the pump.
How can I tell whether the current pump drive ratio is already correct for a modern engine?
Compare the pump’s rated speed and pressure with the engine’s governed rpm and torque peak, verify the nameplate ratio, then measure actual shaft rpm at the pump. The ratio is right when the engine can reach its torque peak while the pump still makes rated flow and pressure. If the engine reaches governed rpm and the pump cannot make rated pressure, the ratio is too tall.
Does a higher-torque engine always mean a faster pump?
No. Flow follows pump speed, so more torque does not turn the pump faster. What torque buys is the capacity to hold pressure under load. Without a matching ratio, that extra torque goes into the shaft and gearbox instead of into water.
What data does the pump supplier need to confirm the ratio?
Engine make, model, rated horsepower, governed rpm and full torque curve; pump model, rated speed, rated flow and pressure, impeller trim, and the current PTO or gearbox ratio. Driveline torque limits and vehicle weight ratings belong in the package too. With those figures the supplier can calculate the ratio.
How long does an FMC fire engine repower with driveline changes take to commission?
Plan on three to four weeks in the workshop for an FMC fire engine repower that includes driveline changes. Custom mounts, shafts or controls can stretch the build to six weeks. Commissioning adds one to three days for pressure and flow tests plus a road trial, and the pump test should be scheduled before the truck returns to service.
Decision Summary
Sign-off is easier to defend when it rests on where the ratio came from, whether the pump stays inside its speed limits, and whether the result can be shown on paper.
- The ratio is derived from the new torque curve, not copied from the original build sheet.
- The pump’s allowable speed range is checked across the whole engine band, not only at rated rpm.
- The calculation and the test results sit in the vehicle file, where the next owner or inspector can find them.