

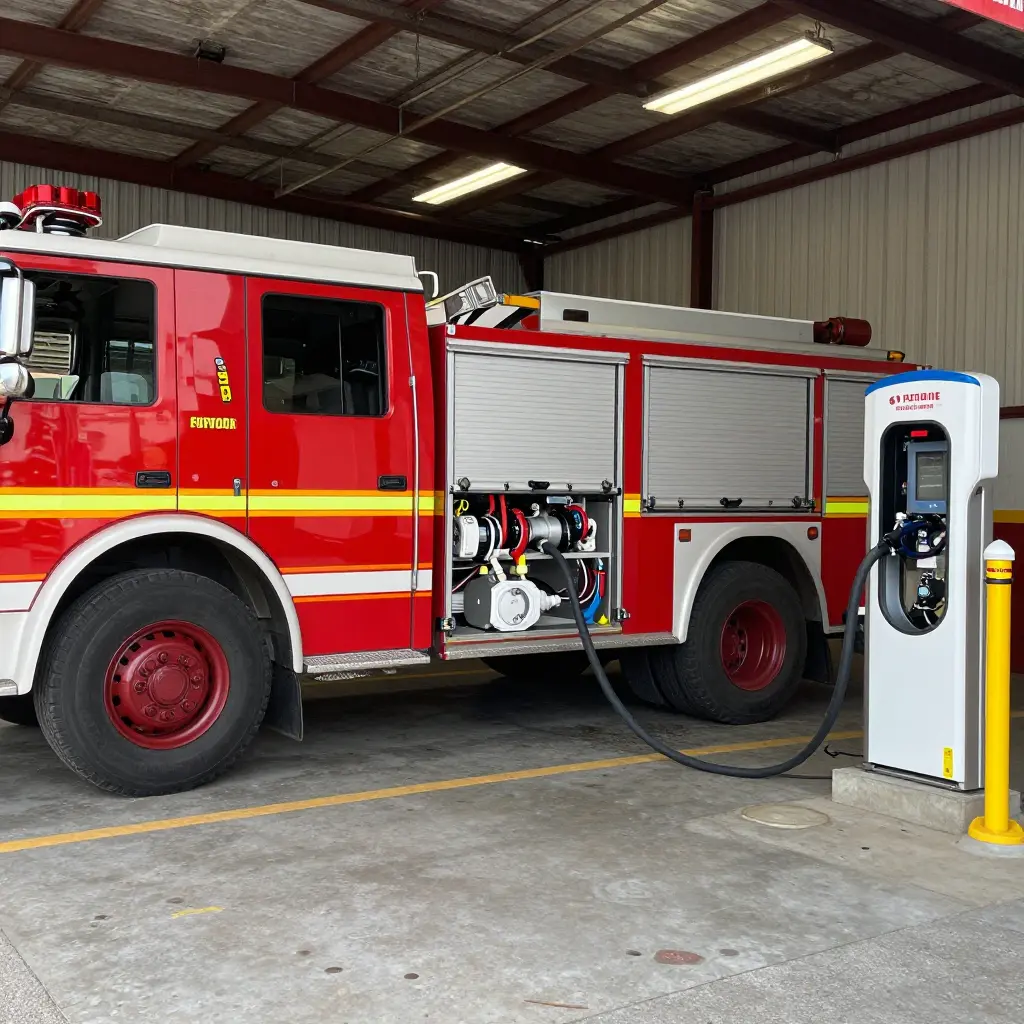
A fire department planning an electric pumper rollout runs into one hard limit before any other: the apparatus bay’s total electrical service capacity. That means the transformer the utility delivers, the rating of the switchgear, the ampacity of the distribution panels, and the conductors that carry load to the point of connection. It does not mean the number of charge dispensers a vendor can quote. Dispensers work as outlets. They distribute whatever capacity the building already has, and bolting more of them to the bay wall does not create more power. A station with a constrained service will support fewer simultaneous electric pumper charging sessions no matter how many dispensers are installed.
The Fenton Fire Department’s apparatus bay charging project is the starting point for what follows. The discussion explains how service capacity sets a realistic upper bound on the number of electric pumpers a station can support, why charger count should come out of a load calculation instead of driving one, and where the capital cost of an electrification program actually concentrates. Fleet managers, fire chiefs, and apparatus procurement teams can use it as a sizing framework before they commit to equipment orders.
Three questions run through it. What can an existing bay service deliver under realistic fireground-return duty cycles? Which transformer, switchgear, panel, and conductor upgrades raise that ceiling? And in what order should a department size infrastructure and order chargers so that apparatus delivery schedules and utility interconnection timelines stay aligned? Departments standardizing charging across a broader municipal fleet vehicles portfolio face the same capacity-first arithmetic at the depot as a whole, not vehicle type by vehicle type.
Key terms used throughout
| Term | Definition as applied in this article |
|---|---|
| Service capacity | Total electrical capacity available at the station service entrance, bounded by transformer size, switchgear rating, panel ampacity, and conductor infrastructure |
| Charger count | Number of discrete charge dispensers installed in the apparatus bay; a downstream configuration choice, not a capacity driver |
| Electric pumper | Battery-electric fire apparatus drawing high-current DC charging loads during bay dwell periods |
| Apparatus bay charging | The charging system design and electrical infrastructure serving fire apparatus within the station bay |
Service Capacity vs. Charger Count
Service Capacity: The Governing Constraint
Service capacity is the total electrical capability a site can deliver to its loads, and it is set entirely upstream of the charging equipment. It includes the utility service entrance rating (amps at a stated voltage and phase), the transformer kVA serving the site, switchboard and panelboard bus ratings, and the ampacity and conduit-fill headroom left in feeders and raceways. The load calculation then determines how much of that envelope survives as spare capacity once existing building and apparatus-bay loads are deducted. Service capacity is finite and code-governed, fixed by the utility interface and the engineered distribution system rather than by the hardware installed downstream.
Charger Count: A Downstream, Conditional Number
Charger count is the physical number of dispensers or charging posts: a count of connection points, nothing more. A dispenser is a load, not a source. It withdraws energy from the grid and cannot manufacture it, so its nameplate rating is deliverable only where upstream capacity and the governing load calculation allow. In fire apparatus electrification, that distinction separates an installed fleet from a chargeable one: electric pumper charging at rated power holds only if the service can absorb the coincident demand of every pumper plugged in at once.
Diversity, Demand Factors, and the Nameplate Illusion
Adding up the nameplate ratings of every dispenser overstates the power a site can actually deliver, because the sum assumes perfect coincidence: every post drawing full rated current at the same instant. Demand factors and diversity factors correct for that. A demand factor relates a load’s actual operating demand to its connected rating; a diversity factor accounts for the likelihood that connected loads do not peak together. Service capacity is a bounded allocation of power against which individual withdrawals have to be reconciled to a coincident peak. A count of withdrawal points says nothing about the peak.
Why Capacity Is Planned Before Count
The sequence is fixed: finish the load calculation, quantify spare capacity, then size charger count to fit inside it. Nothing about municipal fleet platforms changes that order. A count that exceeds the calculation does not fail visibly. It throttles, staggers sessions, or defers them, and the apparatus charges more slowly than specified.
The Chain That Sets the Ceiling
Each gate in the chain is narrower than the one before it, and the tightest constriction sits upstream at the service entrance and transformer, not at the dispensers at the end of the run. Adding dispensers does not widen the gate; only upstream capacity does. Departments planning an electric pumper rollout alongside broader municipal fleet programs should size the source first and the hardware second.
The Service Capacity Audit Checklist
Before signing off on any electric pumper charging build-out, walk the electrical chain from the utility service to the charger with your designer and the utility’s engineering contact in the same conversation. These items most often turn a “we have room for six chargers” assumption into a realistic two-charger plan, because service capacity, not charger count, is what sets the rollout schedule.
- Utility service entrance rating and spare ampacity. Confirm the service disconnect rating in amps and document the true spare ampacity after coincident building load. Nameplate arithmetic and metered peaks rarely agree.
- Transformer kVA and available headroom. Verify the serving transformer’s kVA rating and how much of it is already consumed. A transformer swap can add months and a five-figure bill before the first cable is pulled.
- Switchboard and panelboard capacity. Check spare breaker positions and bus ratings at both the main switchboard and the distribution panel feeding the apparatus bay. A full bus is a hard stop no matter how many amps are available upstream.
- Feeder and conduit routing capacity. Inspect existing feeder sizes and spare conduit fill or duct bank capacity along the route to the bay. Re-trenching a slab is often the most expensive line item in an electric pumper charging project.
- Physical space for transformer or switchgear upgrades. Measure available clear space and confirm code-required working clearances for any new pad-mounted transformer or lineup, including ventilation and fire separation requirements.
- Load calculation basis and design margins. Ask the designer to show the basis for coincident versus simultaneous charging, the demand factors, and the growth margin, then challenge any assumption that all pumpers will charge at peak rate at once.
- Metering and monitoring provisions. Confirm dedicated metering, sub-metering, and data logging at the charger level so later capacity decisions rest on measured duty cycles rather than estimates.
Treat that list as the audit trail for your procurement file. With each line answered in writing, you can defend a charging scope to a chief, a council, or a utility reviewer, and you can separate the bays you can serve today from the ones that need a service upgrade first. Fleet managers planning broader municipal fleet electrification will find the same audit logic applies yard-wide.
Duty-Cycle Energy Demand and Dwell Time
From Run Volume to Energy Throughput
For an electric pumper, readiness is an energy balance, not a fuel gauge reading. The duty cycle of a station – the number of responses per 24-hour period multiplied by the energy consumed per response, including the hotel loads drawn at the scene and during pump engagement – sets the total energy that must be replaced between dispatches. State-of-charge (SOC) targets then decide how much of that throughput is non-negotiable. A minimum SOC threshold acts as a floor below which the apparatus should not be released for service, so the energy to be recovered is not just what was consumed but what is needed to climb back above that floor, plus whatever margin the department reserves for unplanned calls. Two stations with identical run volumes can therefore carry very different demand profiles if their SOC policies and reserve margins differ.
Why Dwell Time Governs Required Power
Dwell time – the interval between return to quarters and the next dispatch – converts energy throughput into a power requirement. Power is energy divided by time, so required charging power scales inversely with the available recovery window. A long, predictable dwell allows modest, steady apparatus bay charging from a relatively small connection. A short window compresses the same energy transfer into a fraction of the time and multiplies instantaneous demand. The curve is steep at the short end: halving dwell time doubles the required power, and halving it again doubles it once more.
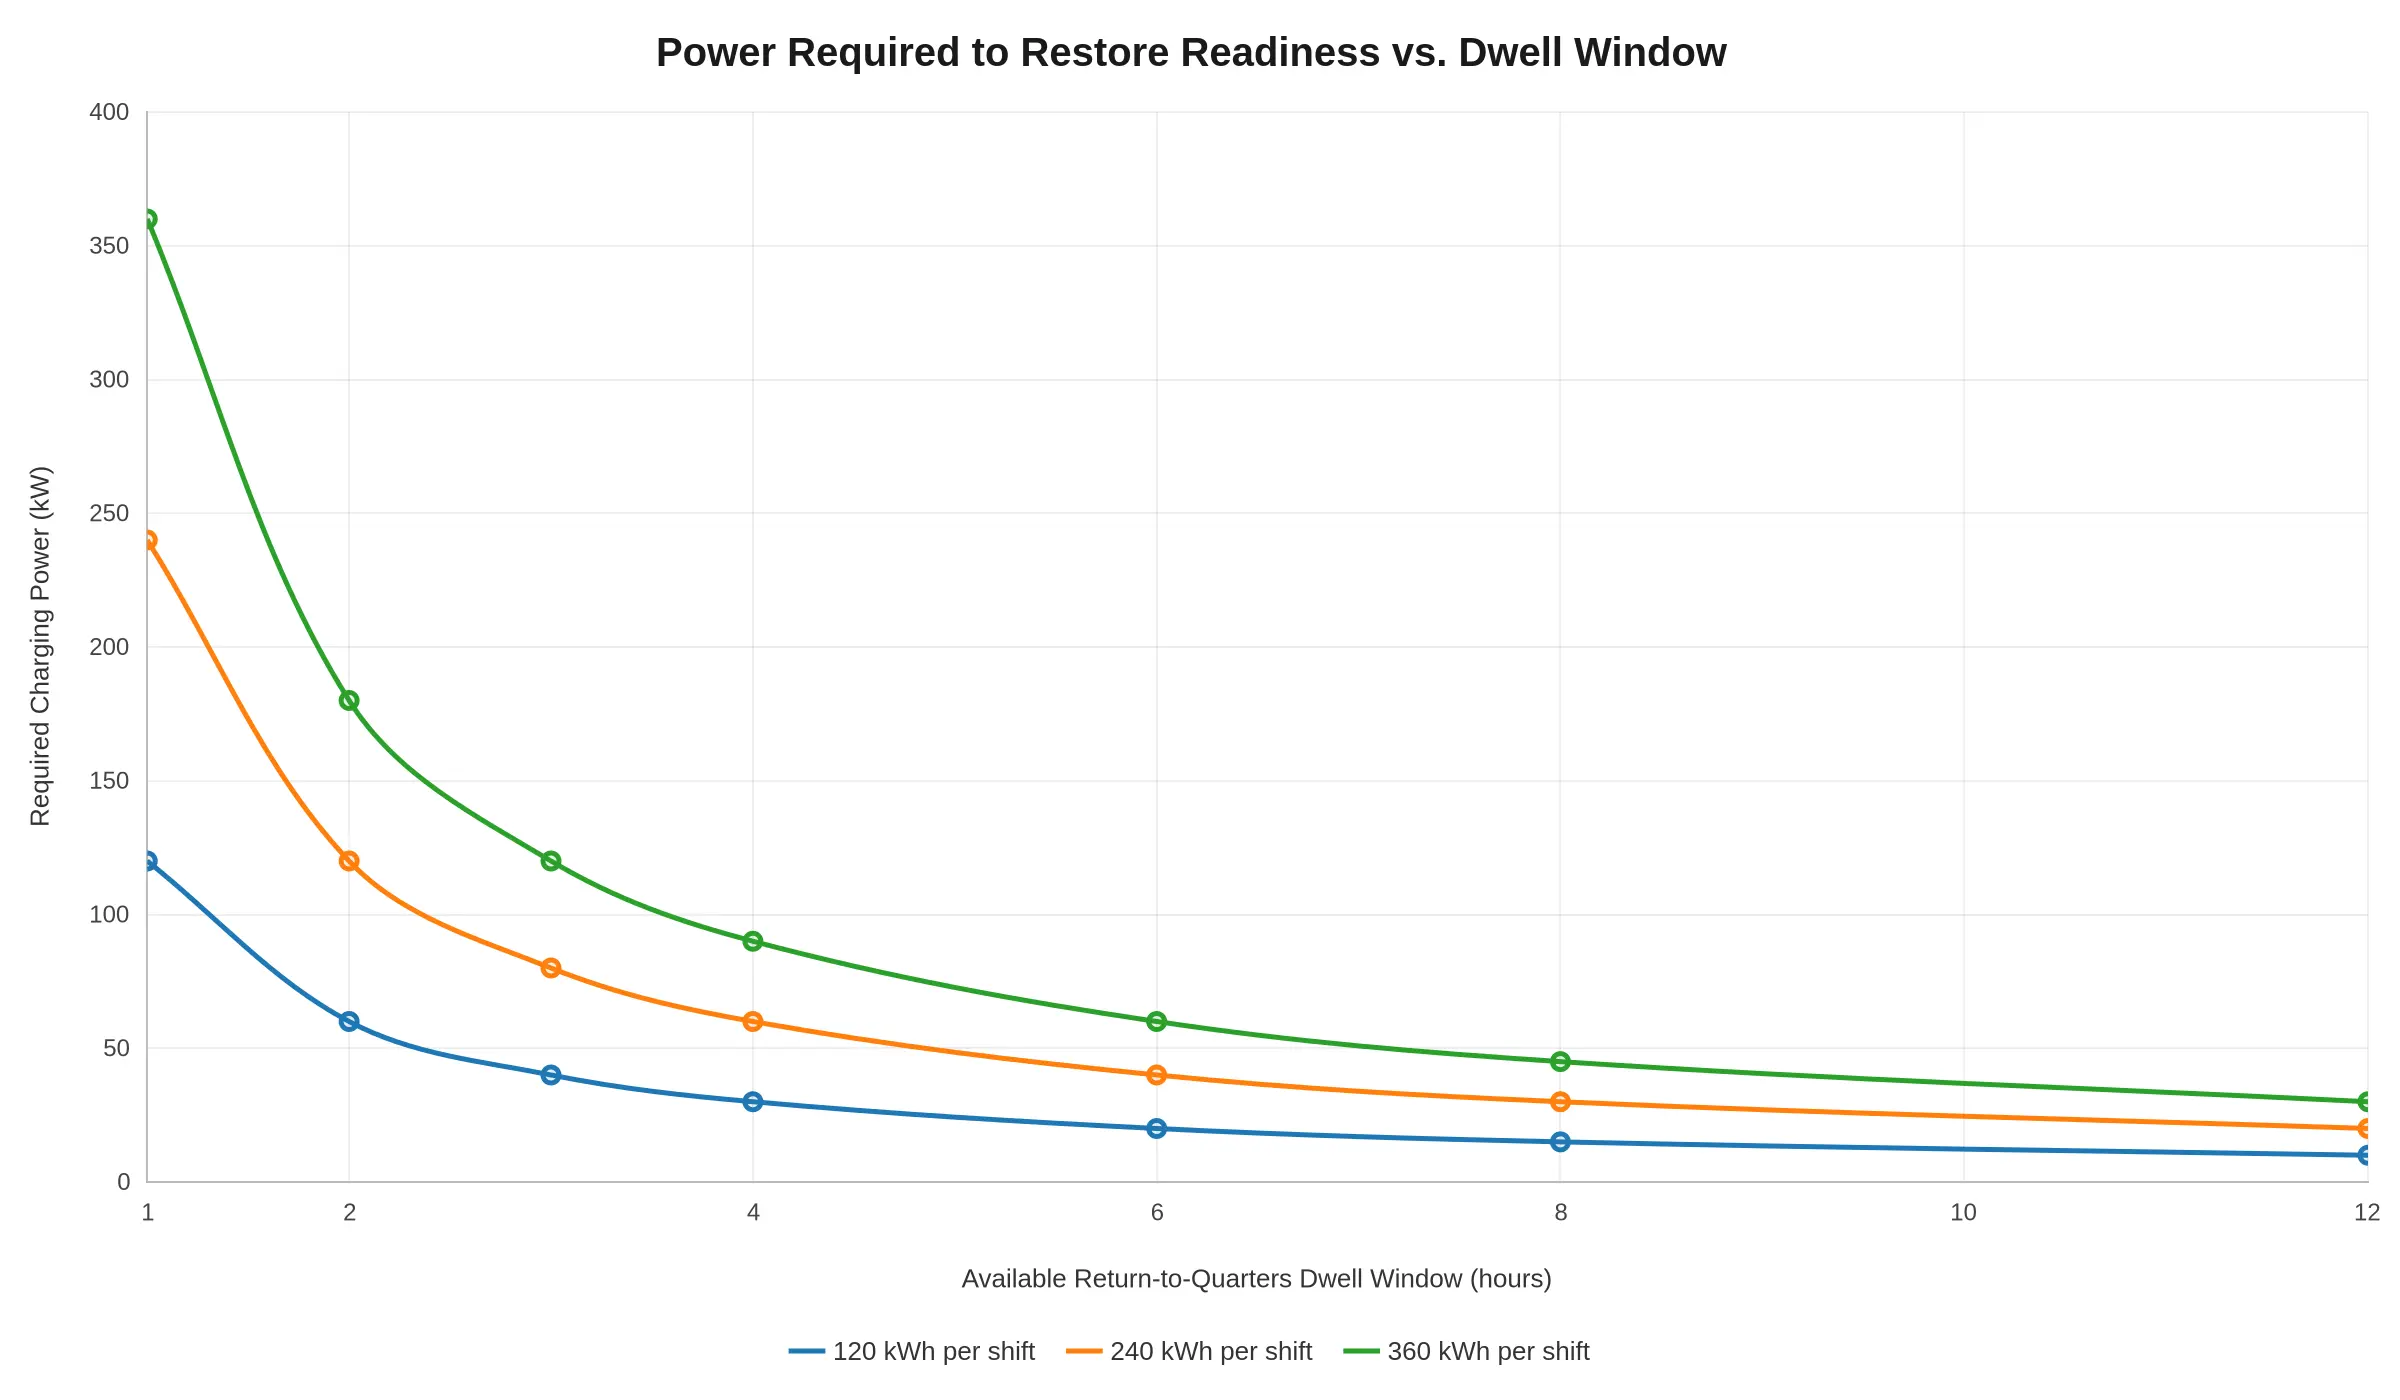
Short Windows Press Directly Against Service Capacity
A station with generous dwell windows can stagger charging events across a shift and keep aggregate demand inside the transformer, switchgear, and feeder limits already serving the building, adding capability without a service upgrade. A station whose apparatus returns and redeploys within a narrow window has no such flexibility. Its energy has to flow at a high rate, and that rate draws hard against the site’s electrical ceiling. More charging ports do not raise the ceiling, and several pumpers recovering at once can stack their peaks. Agencies should model fleet energy throughput against realistic dwell distributions before specifying charging hardware, and where windows are structurally short, budget for the service upgrade that makes high-power recovery physically possible. That is an infrastructure question best settled alongside municipal fleet platform selection, not after delivery.
The Gap Between Installed Chargers and Chargeable Pumpers
A dispenser count on a spec sheet tells you how many cables hang in the bay. It does not tell you how many electric pumpers the building’s electrical service can energize at the same time. The chart below contrasts the two numbers across four representative service-capacity tiers. Dispenser counts climb in a straight line; deliverable simultaneous charging capacity climbs far more slowly.
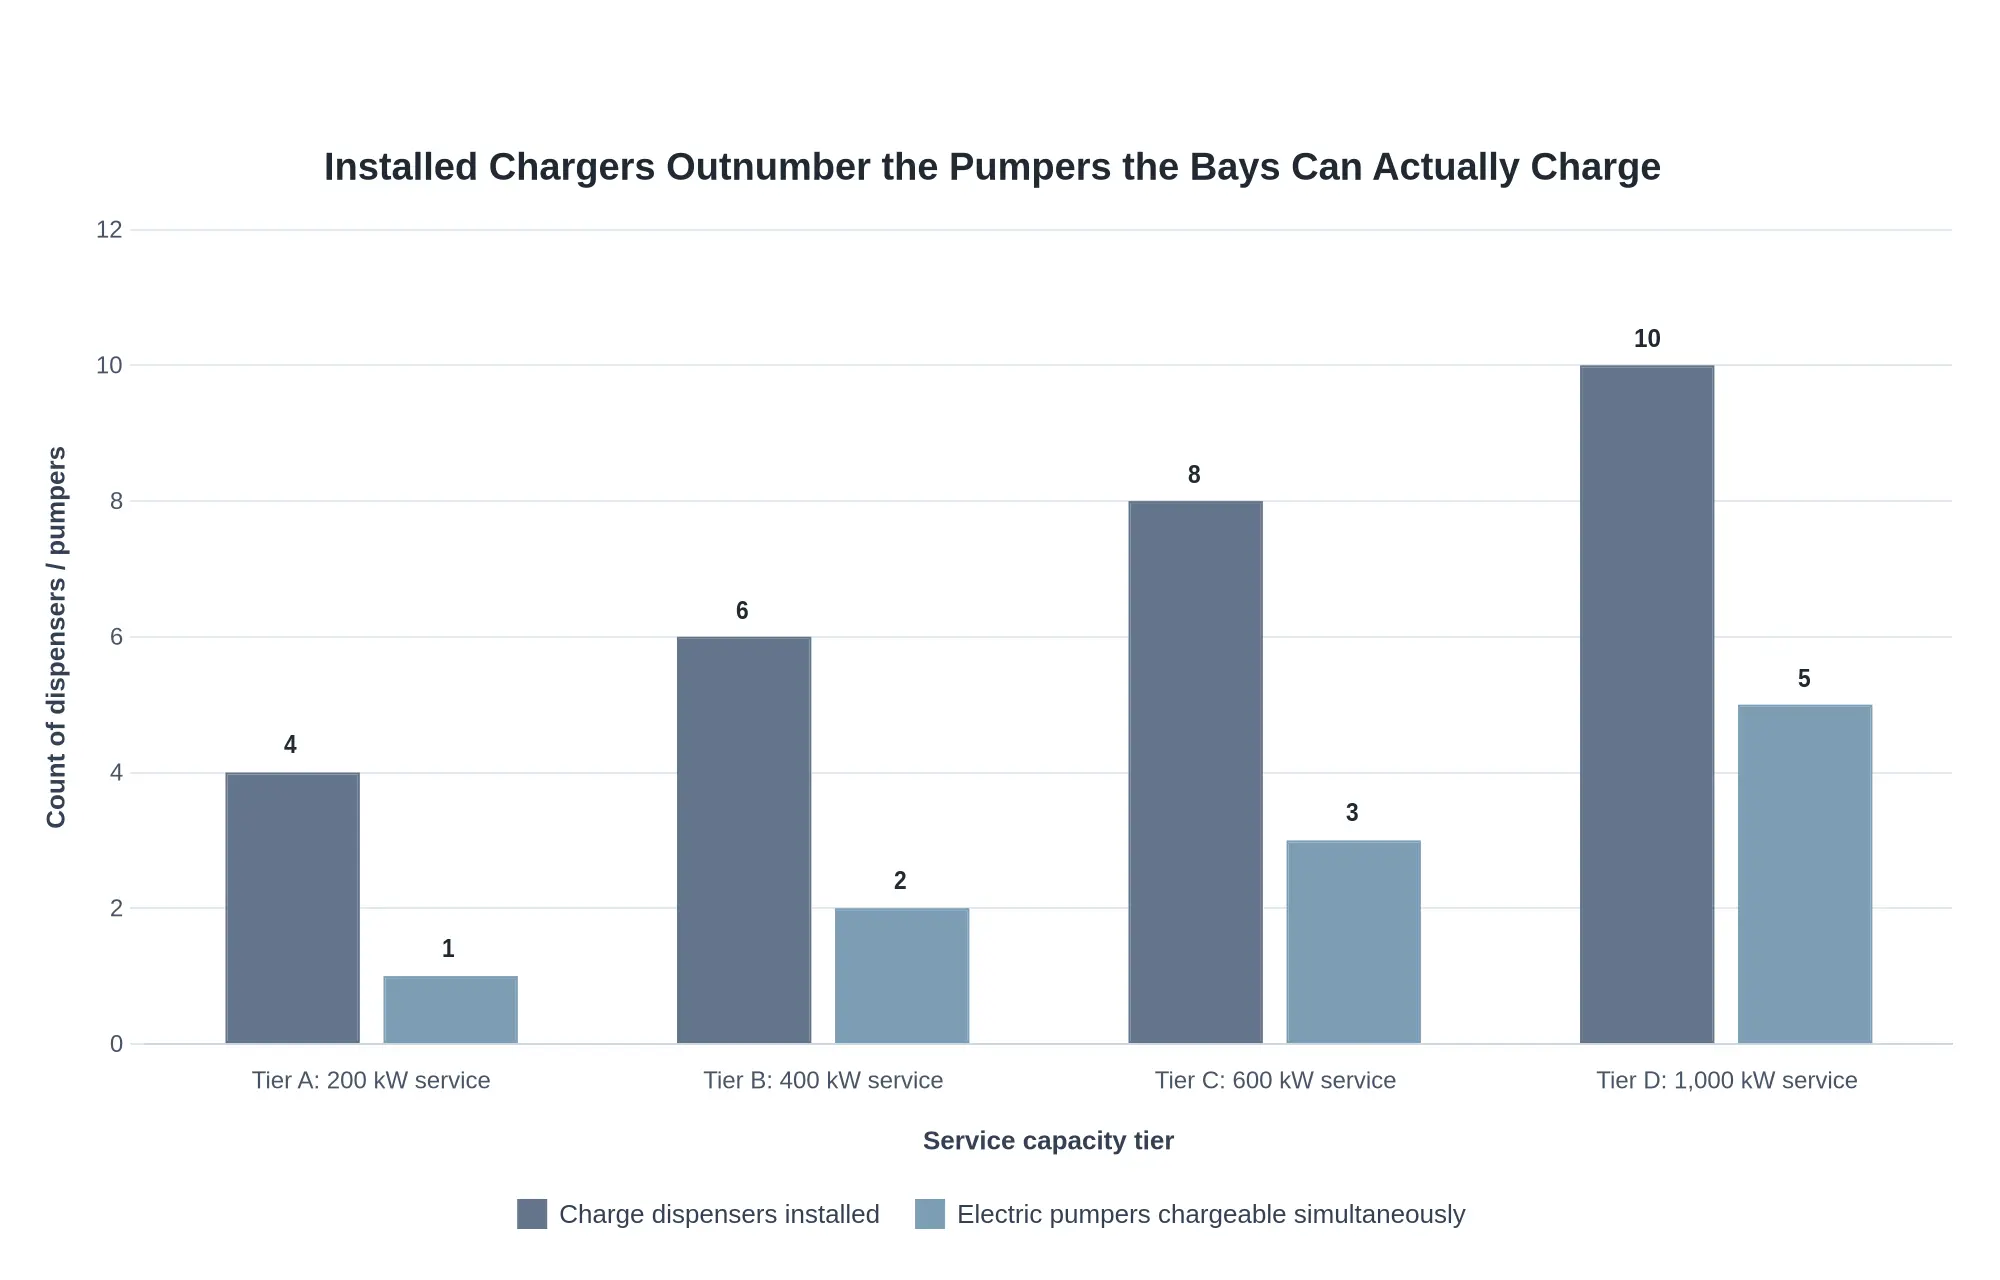
The gap between the paired bars is the bay’s “phantom capacity”: dispensers that are physically present but cannot be co-energized within the site’s service capacity. The pumper count on the right, not the charger count on the left, governs how fast an electric fleet can actually roll out.
Why the bars separate so sharply comes down to what a single pumper demands. A 500 kWh-class apparatus pulling 150-250 kW during a fast turnaround can consume the better part of a mid-size service on its own, so three dispensers sharing a 400 kW feed may support only one or two trucks at full rate at any given moment. Fleet managers planning municipal apparatus charging programs should therefore size the transformer and switchgear first, then specify dispensers to match that envelope.
Utility Interconnection and Upgrade Lead Times
Interconnection Studies Set the Front End of the Schedule
Every service upgrade starts with a utility interconnection application, which the utility processes through a sequence it controls: initial load screening, a system impact or feasibility study, and, where the added load materially affects the distribution circuit, a facilities study that specifies the physical work. That work may be a new or upsized transformer, reconductoring, protective device changes, or a dedicated service. Each stage is a gate. The next cannot be scheduled until the prior study is issued, and queue position depends on the utility’s engineering workload and the load already committed in the service area. The department cannot compress those intervals, so the application should be filed at project initiation rather than after apparatus selection is finalized.
Transformer Availability and Service Upgrade Permitting
Transformer and switchgear availability is the second dependency. Pad-mounted transformers in the capacity ranges required for multi-port electric pumper charging are often built to order, and medium-voltage switchgear, metering cabinets, and service conductors carry their own manufacturing and delivery intervals. A service upgrade usually also requires electrical permitting and inspection, a revised service agreement, and, in some jurisdictions, site plan review for the transformer pad or vault. Because these steps run in series with the utility’s construction crew scheduling, the amperage actually delivered to the apparatus bay determines the energization date, and the project plan should treat it that way.
Sequencing Utility Work Against Charger Procurement
An early purchase order secures a delivery slot and a price. It does not shorten the interconnection study, move the department up the utility queue, or get a transformer manufactured sooner. The hardware arrives and waits, with storage obligations and warranty clocks running. Treat service capacity as the critical-path item: establish the required connected load early, submit the interconnection request before locking charger counts, and time charger release and installation to the utility’s committed energization date. For apparatus bay charging, equipment delivery, rigging, and commissioning should be scheduled backward from that date rather than forward from the procurement calendar. Departments evaluating municipal apparatus platforms can use the same logic: confirm the electrical envelope before committing to the vehicle and charging configuration, so the infrastructure track and the procurement track converge on a single realistic in-service date.
Nameplate ratings on a dispenser spec sheet say what a single unit can deliver. They do not say what the site can support once several units are energized at once. The table below shows how charger count and service capacity interact inside a fixed-capacity apparatus bay, using clearly illustrative values rather than measured data, in line with the wider logic of municipal fleet electrification.
| Charger Configuration | Nameplate Rating per Dispenser | Dispensers Installed | Simultaneous Charging Assumption | Deliverable Power Within a Fixed Service Capacity | Resulting Electric Pumper Readiness Impact |
|---|---|---|---|---|---|
| Single dispenser on dedicated capacity | ~150 kW (illustrative) | 1 | One pumper at a time | Full ~150 kW available to that pumper | Shortest illustrative charge window; fastest return to service |
| Two dispensers sharing fixed capacity | ~150 kW (illustrative) | 2 | Both dispensers active | Roughly ~75 kW per pumper | Charge time approximately doubles versus solo charging |
| Three dispensers sharing fixed capacity | ~150 kW (illustrative) | 3 | All three active | Roughly ~50 kW per pumper | Charge windows lengthen further; readiness depends on staggered scheduling |
| Four dispensers sharing fixed capacity | ~150 kW (illustrative) | 4 | All four active | Roughly ~37 kW per pumper | Longest illustrative charge time; realistically one or two pumpers mission-ready at once |
| Four dispensers plus added service capacity | ~150 kW (illustrative) | 4 | Two active, two idle | Full ~150 kW to each of two pumpers | Restores short charge windows while keeping spare apparatus available |
All power figures are simplified illustrations of the shared-capacity relationship, not measured site data.
Raising charger count without raising service capacity divides the same available power across more dispensers, which stretches every charge window and delays electric pumper readiness.
Load Management and Charge Sequencing Strategy
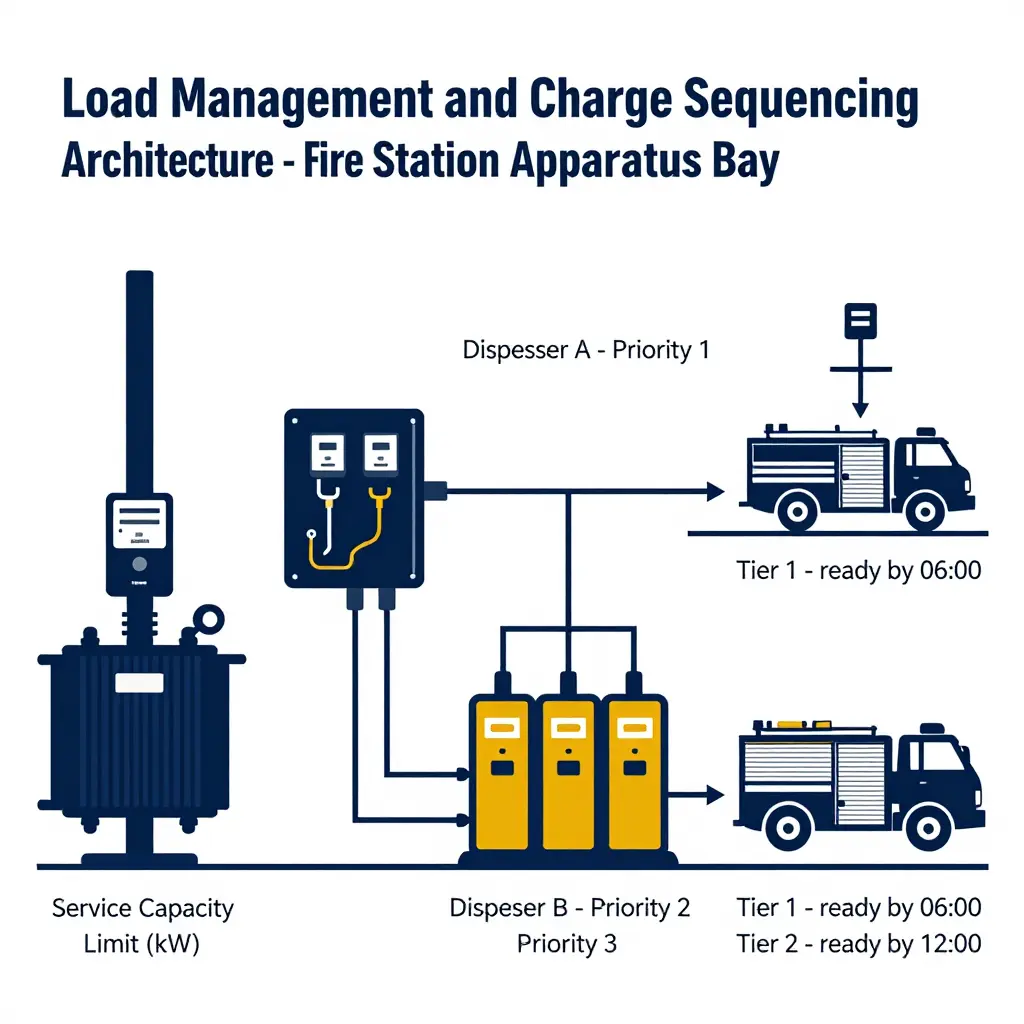
Where a station’s electrical service cannot run every dispenser at nameplate output simultaneously, load management turns a fixed service capacity into something the station can schedule. Instead of sizing the installation around aggregate full-rate demand, the designer assigns each dispenser a managed power allocation envelope and enforces an aggregate ceiling at the service entrance. The distinction matters from the outset: charger count is a hardware quantity, while usable capacity depends on diversity, duty cycle, and each vehicle’s charge-acceptance curve. A station with four dispensers may serve an electric pumper and its stablemates on a service that could never run all four at peak, provided the allocation logic is specified early and coordinated with the apparatus procurement cycle. The same principle applies across municipal fleet electrification programs.
Sequencing then becomes a scheduling problem defined by readiness requirement, not by convenience. Each apparatus gets a priority tier derived from run volume, reserve status, and mutual-aid commitments, so the electric pumper designated first-out reaches its target state of charge before shift change while later-due units absorb the rest of the available window. Power-sharing architectures make this practical at the hardware layer: shared feeders, circuit-sharing dispensers, and power cabinets that reallocate kW among connected vehicles as one approaches taper. Demand limiting adds a hard setpoint at the service entrance, implemented through controller logic and load-shedding relays and, where the utility program allows, demand-response curtailment that trims charging rates during system peaks without isolating a vehicle from the bus.
Verification closes the loop, because a load calculation is only an assumption until it is measured. Interval submetering at the service entrance and at each dispenser lets the actual consumption profile be compared against the modeled diversity factors, concurrency assumptions, and charge-acceptance curves used in design. Persistent shortfalls point to conservative assumptions; unexplained peaks mean the allocation logic is not holding and the sequencing priorities need revision. Load management buys operational headroom and defers capital spending, but it does not replace a service upgrade once sustained demand approaches the calculated limit.
Apparatus Bay Electrical Load Composition
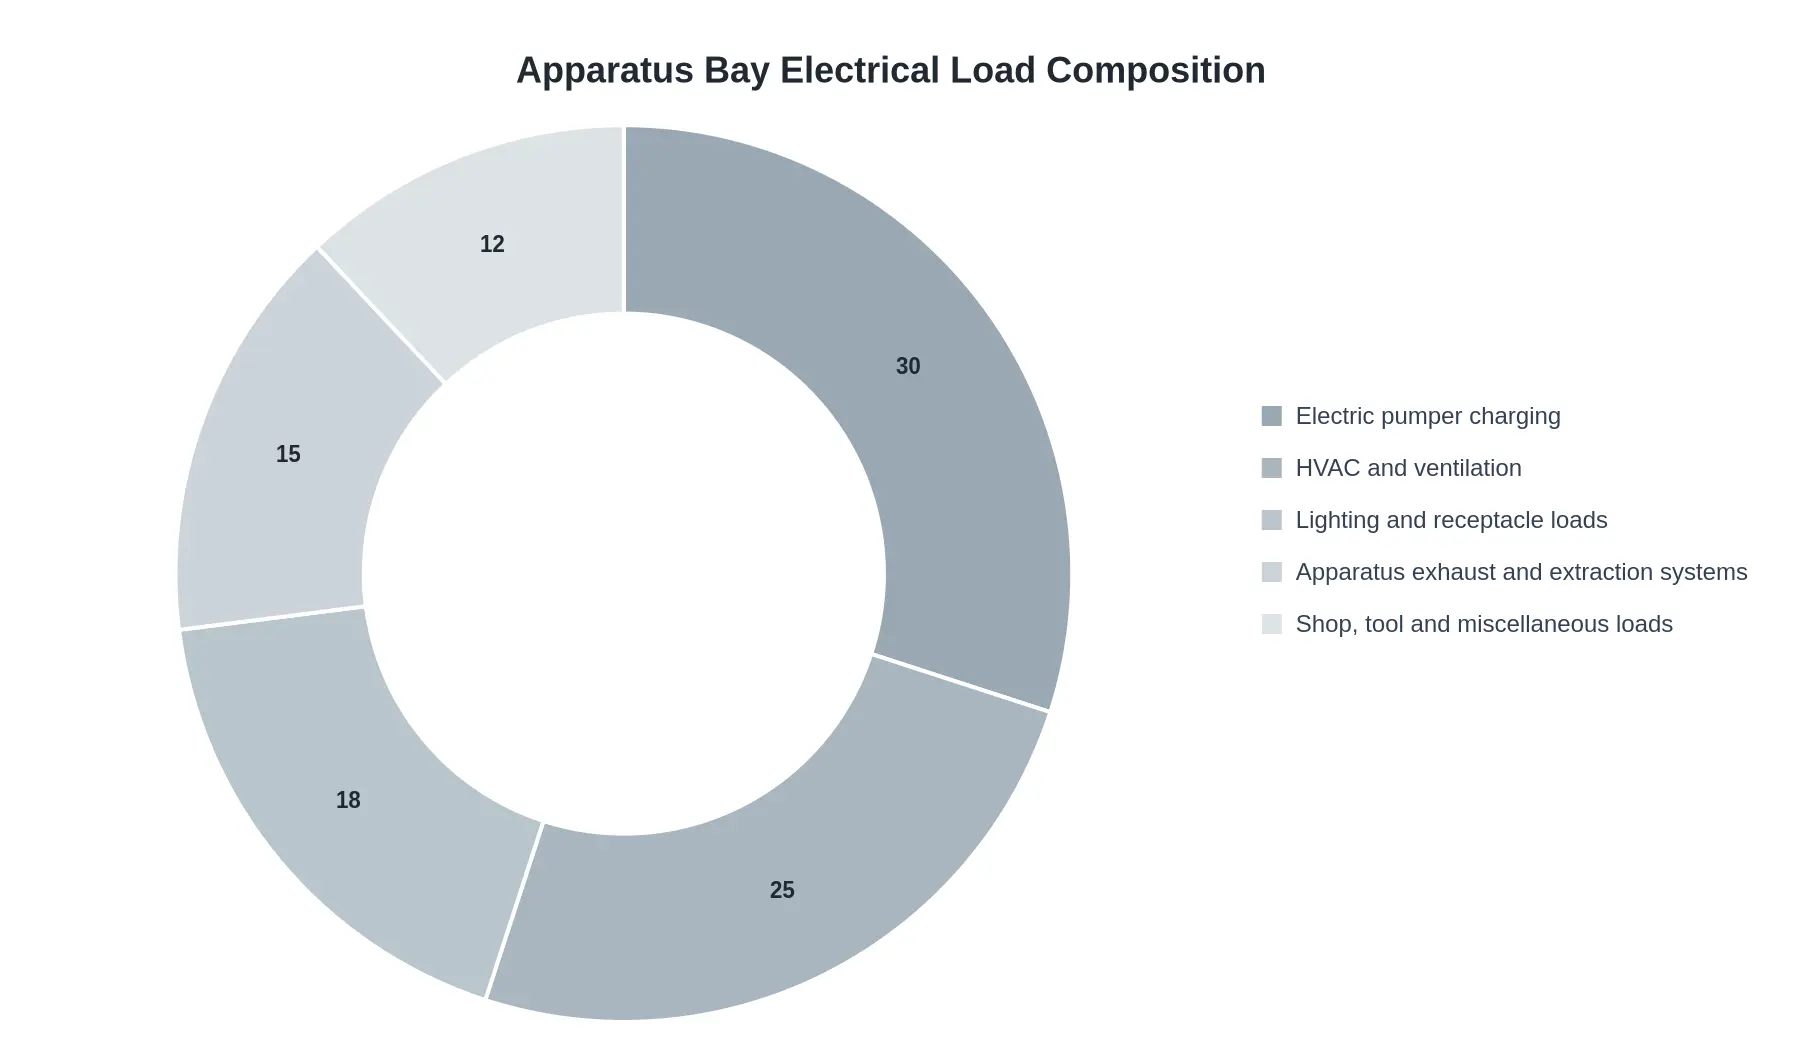
An apparatus bay is not an empty box waiting for a pumper to plug in. It is a working facility with heating, ventilation, exhaust extraction, lighting, receptacles, and tool loads all drawing from the same service. The doughnut chart below shows one realistic allocation of a bay’s total connected electrical load, with charging at 30 percent rather than the whole thing.
What the Chart Is Telling You
The arithmetic is the point. A 400-amp, 480-volt three-phase service looks generous if you treat all of it as a charging resource. Subtract HVAC, exhaust extraction, and building loads and the charging envelope is meaningfully smaller than the service rating on the panel door. Apply demand factors and code-mandated diversity and it shrinks again. Charging is the largest single slice here, but it is one slice.
That is why charger count is such a misleading metric. Four chargers on a service that can only support two at peak draw will queue, derate, or trip. Fleet managers planning an electric pumper rollout should treat service capacity as the binding constraint and let charger count follow from it, a discipline that applies equally across municipal fleet categories where bay allocation is shared among multiple vehicle types.
Reading the Slices in Practice
| Load Category | Share | Why It Matters |
|---|---|---|
| Electric pumper charging | 30% | Largest single load; the one you can schedule and shape |
| HVAC and ventilation | 25% | Continuous and seasonal; hard to defer during response hours |
| Lighting and receptacle loads | 18% | Partially controllable, largely fixed at shift change |
| Apparatus exhaust and extraction systems | 15% | Interlocks with apparatus movement; runs when trucks move |
| Shop, tool and miscellaneous loads | 12% | Small but bursts unpredictably during maintenance |
Only the first slice responds well to load management. The others keep running whether or not a pumper is on charge, which is why the available charging envelope, not the number of pedestals, should govern rollout timelines.
Turning the Analysis into Specification and Procurement Requirements
Document the service capacity and load calculation in the design package
The fastest protection against expensive change orders is to make the electrical basis of design a contractual deliverable. Require the design package to include a documented service capacity and load calculation – signed and sealed by a licensed electrical engineer – showing the existing utility service, the spare capacity available after existing building loads, the projected charging demand, and the diversity or demand factors applied. That single requirement forces the fleet manager, the fire department, and the utility to agree on the same numbers before apparatus is ordered. If the calculation shows the service cannot support simultaneous full-rate charging of every pumper on day one, the finding belongs in procurement, not in commissioning.
Specify delivered power per apparatus, not dispenser count
Charger counts are a poor proxy for capability, so write the specification around the kilowatts actually delivered to each apparatus. State the required continuous power at the onboard charger input under real bay conditions, not the nameplate rating of the dispenser, and require bidders to document the derating curve and ambient temperature assumptions behind their figures. Sequencing and load management belong in the charging equipment specification as mandatory features: the equipment must allocate available capacity by priority, stagger ramp-up on cold-start mornings, and throttle individual sessions without tripping the service. Where a department is scaling electrification across a broader mix of units, the same appliance-level thinking applies to the wider range of municipal fleet categories now available in electric configurations.
Define acceptance testing of actual delivered power
Acceptance should be measured, not assumed. Specify a witnessed commissioning test that records delivered power per apparatus over a sustained interval at representative bay temperatures, verifies load-management behavior with multiple apparatus charging simultaneously, and documents the resulting demand profile against the design calculation. Passing that test, not merely energizing the equipment, should be the condition for final payment.
| Specification clause | What to require |
|---|---|
| Service capacity | Sealed load calculation with diversity factors and spare capacity stated |
| Delivered power | Continuous kW per apparatus at charger input, with derating curve |
| Load management | Priority-based allocation, staggered ramp-up, no service trips |
| Acceptance | Witnessed power and demand-profile test as payment condition |
Plan beyond the first pumper
Charging infrastructure decisions rarely stay contained to one vehicle class. Departments that solve service capacity for a pumper are usually only a budget cycle away from electrifying support equipment, and the lessons transfer directly to municipal electrification scaling across road-cleaning fleets, where duty cycles and dwell times differ sharply. The chassis and payload questions are shared as well: designers working through battery mass, axle loading, and body integration on a pumper are solving problems similar to those in heavy-duty chassis and payload engineering considerations on vocational trucks. Specifications written in delivered kilowatts and documented load calculations keep those conversations grounded in physics rather than marketing.
Before a single dispenser is mounted on the wall, the gating logic should run in a fixed order: measure the service, test the requirement, then act. The decision flow below keeps that sequence explicit so the agency’s answer to “how many chargers?” cannot skip ahead of the electrical reality.
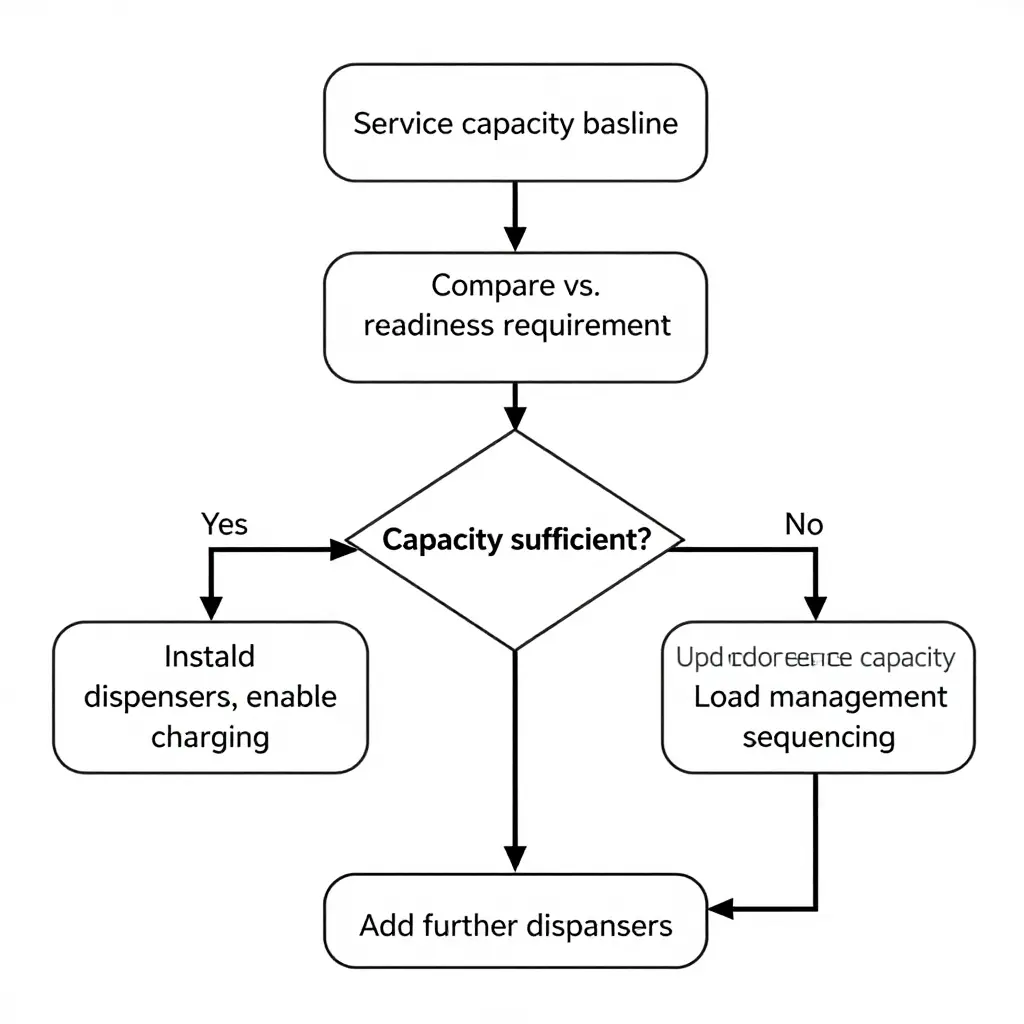
At the decision node, the upper branch is the fast path: baseline confirmed, dispensers installed, charging enabled, pumper in service. The lower branch is the disciplined path, and it forks again, because a capacity upgrade and a load management sequencing strategy are two different answers to the same constraint. Either one has to be resolved before additional dispensers are added. Skipping that gate is how departments end up with hardware they can run only at partial output. For the same reason, sizing is usually evaluated alongside the broader municipal fleet platforms that will eventually share the service.
Conclusion: Service Capacity Sets the Pace, Charger Count Follows
Service capacity determines the pace of a rollout; charger count is a downstream output of that constraint. Delays in this kind of project show up at the transformer, the switchgear, or the utility interconnection, not at the dispenser. At a station with a fixed service, the energization date is decided by the electrical work upstream, long before anyone specifies a charging unit. Treating charging hardware as the starting point inverts the engineering logic and buries schedule risk inside a procurement document, where it resurfaces months later as a delayed energization date.
That inversion is avoidable, but only if fleet managers sequence decisions deliberately rather than simultaneously. The four steps below put the electrical constraint ahead of the purchasing decision, and they translate cleanly to the wider municipal fleet solutions most departments also operate.
- Baseline assessment. Document the electrical position at each apparatus bay: transformer rating, spare panel capacity, available 24-hour load, and any utility-imposed limits on the feeder. Verify against nameplate data and interval-metered history rather than architectural drawings.
- Readiness requirement definition. Convert response requirements into energy terms. How many apparatus must return to full state of charge, within what window, during the worst week of the year rather than the average one? That answer defines the kilowatts the site has to deliver.
- Capacity-first design. Size the electrical infrastructure to the readiness requirement, including transformer upgrades, service expansion, and any on-site generation or storage needed to close the gap. Permitting and utility timelines for this step sit on the critical path, so they set the schedule.
- Dispenser deployment with load management. Only now select charging units, and specify load management that allocates power across the bay so simultaneous charging never exceeds the established envelope. Hardware becomes a configurable quantity inside a fixed capacity instead of the constraint itself.
Viewed this way, infrastructure-driven electrification planning stops being a procurement afterthought and becomes the planning instrument itself. Departments that move through the next decade cleanly will model available power first and order equipment second, treating every added charging unit as proof of capacity already in place rather than a hope that it can be found later.
Frequently Asked Questions: Service Capacity and Apparatus Bay Charging
Can we add more chargers as long as the electrical panel has open breakers?
Not reliably. Open breaker spaces indicate available circuits, not available capacity, because the panel bus rating and the upstream transformer set the ceiling on total connected load. A panel with spare breakers can still be at its calculated demand limit once simultaneous apparatus bay charging loads are applied, so the answer requires a load calculation rather than a visual inspection of empty slots.
How much service capacity does a single electric pumper typically require?
It depends on battery size and the chosen charge rate, but the range is wide enough to matter at the service level. An apparatus charging at 50 kW draws roughly 50 kW plus conversion losses, while DC fast charging in the 150-250 kW range can consume a majority of a small station’s existing service capacity by itself. Level 2 charging at 19.2 kW is far more modest, but it only works when dwell times are long enough to deliver the required energy.
Can load management fully replace a service upgrade?
Usually not. Load management reduces peak coincident demand and can defer an upgrade, but it does so by sequencing, throttling, or delaying charge sessions, which trades readiness for capacity. Where a department needs multiple apparatus returned to service within a short window, load management narrows the gap without closing it, and that readiness constraint should be documented before load management is treated as a substitute.
How should charger count be specified relative to service capacity?
Specify charger count against a load calculation, not against bay count or budget. Establish the peak coincident charging load the service can support with a safety margin, then set the number of ports and per-port power so the total stays beneath that ceiling. Recording those assumptions in the procurement documents keeps the specification defensible when usage patterns change.
What data should be collected after commissioning to validate capacity assumptions?
Collect interval-level energy (kWh) and demand (kW) per port, session durations, apparatus arrival and departure times, the utility meter’s monthly peak demand, and any curtailment events triggered by the load management system. Comparing measured peak coincident demand against design projections shows whether service capacity was sized correctly or whether charger count should be held flat until infrastructure is upgraded. Several months of data, including at least one heating-season peak, give a more honest picture than a single billing cycle.
Departments staging both apparatus and support units on the same site may also want to review municipal vehicle platforms when planning bay allocation and charging positions.