


Why Rural Fleet Uptime Starts With Service Network Distance
Buyers of Brindlee Mountain fire apparatus spend most of the negotiation on the price at the top of the quote. It is the smallest number on the page, and it is the one figure that tells you nothing about whether the truck answers calls next winter. Price gets read in a meeting. Coverage gets tested on a county road at 2 a.m.
The drive to the shop eats availability before a wrench is picked up. Four hours each way is most of a shift gone. Parts add to that wait: a component pulled from a distant depot shows up days after the call, not hours. Then recovery, where a pumper dragged 200 miles occupies a tow truck and a crew for a day nobody scheduled.
Two quotes therefore belong side by side on coverage before anyone compares dollars: drive time to the nearest stocked bay, depot count, depth of local parts stock, travel radius. Buyers who compare municipal fleet options on those terms find out which figure predicts availability and which one only repeats what the truck cost.
The Listed Price Is the Entry Point, Not the Decision
A purchase price happens once. Downtime happens every week for the life of the rig. Fire apparatus pricing belongs at the top of a ledger, not at the bottom of it.
Capital outlay is the easy layer: visible, fixed, settled at delivery. Maintenance and parts consumption accumulate across every operating cycle, and how large they grow depends on how fast parts reach the bay. The expensive layer rarely appears in a bid at all. An unavailable truck still owes the same response obligations, so one unscheduled day becomes standby rentals and borrowed coverage that repeat until the unit returns.
Owners weighing total cost of ownership for municipal fleet vehicles compare those three layers against service proximity, not against sticker figures alone. A lower list price wins only when the network behind it is equal or closer. Where distance adds days to a parts order or a technician’s arrival, uptime erodes faster than the savings compound.
Listed Price vs. Uptime Cost: A Side-by-Side Comparison
The middle and right-hand columns are the ones that keep charging money after delivery, and they are where municipal fleet purchases are usually decided without anyone noticing.
| Cost or Risk Factor | How It Appears in a Quote | How It Shows Up Over a 10-Year Operating Cycle | Why Service Distance Changes the Outcome |
|---|---|---|---|
| Unit purchase price | Single capitalized line item, stated once | Paid once at delivery, then depreciated on a fixed schedule | A low sticker from a remote seller buys no faster response |
| Technician travel time per service event | Often excluded, or buried in a trip charge | 4 to 16 billable hours per event, across 60 to 120 events | Every added mile is paid twice, outbound and return |
| Parts lead time | Quoted as parts availability rather than calendar days | 3 to 21 days per order, stacked across every repair | Nearby parts stock shortens each order cycle |
| Scheduled maintenance intervals | Listed as service intervals, with travel days unstated | 8 to 12 visits, each carrying its own travel day | Longer hauls push routine intervals off schedule |
| Recovery and transport distance | Appears as a towing allowance or as an outright exclusion | 1 to 3 events, at 100 to 400 miles per event | A closer service bay cuts recovery mileage and fees |
| Downtime cost per day of unavailability | Absent from the quote entirely | 1,500 to 6,000 USD per day of lost service | Shorter travel shortens every day on the clock |
Price the second and third columns before signing. The listed figure sets the entry point; the network behind it sets how many days the fleet spends working.
How Service Network Distance Converts Into Downtime Hours
Distance does not add one repair cost. It repeats across every service event the vehicle will ever need, which is the difference between a cheap purchase and an expensive asset.
Four intervals decide the clock: how long a notification takes to become a dispatched technician, technician travel to the unit, parts travel to the unit, and the return-to-service check before the unit goes back on duty. On a short network each one is measured in hours. On a rural network each drifts into days, and they stack rather than overlap.
Downtime hours = hours per service event x events per year. A unit carrying a 2.5-hour service-event overhead, tripping 24 events in a year, loses 60 hours of availability before the repair itself is counted. For teams handling shared municipal fleet service planning across municipal vehicle platforms, that figure compounds with every chassis in the yard.
Compare downtime hours, not kilometres. Kilometres are a line on a map; downtime hours are the cost you actually pay.
Five Signals That Service Distance Is Shaping Your Uptime
For municipal fleet buyers the sticker price says almost nothing about any of this.
- Travel time to the nearest authorized service point, measured in hours rather than miles. That number sets the floor under every repair delay the crew will absorb.
- Parts stocked at the point versus shipped from a central warehouse. Local inventory turns a two-day wait into an afternoon fix; central shipping adds days to every breakdown.
- Certified technicians inside the radius. When qualified hands are scarce, scheduled work queues behind someone else’s emergency.
- Heavy towing and secure transport in the region, which decides whether a disabled pumper comes back in days or weeks.
- Scheduled maintenance batched with other municipal units at one depot. Shared service windows cut travel and downtime; solitary trips multiply both.
What Distance Actually Costs You
A service network is only as good as the drive to reach it. The chart below tracks vehicle unavailability as a fleet moves further from an authorized service point, drawn from service-event records where parts, technicians, and travel time all stack up against the operator.
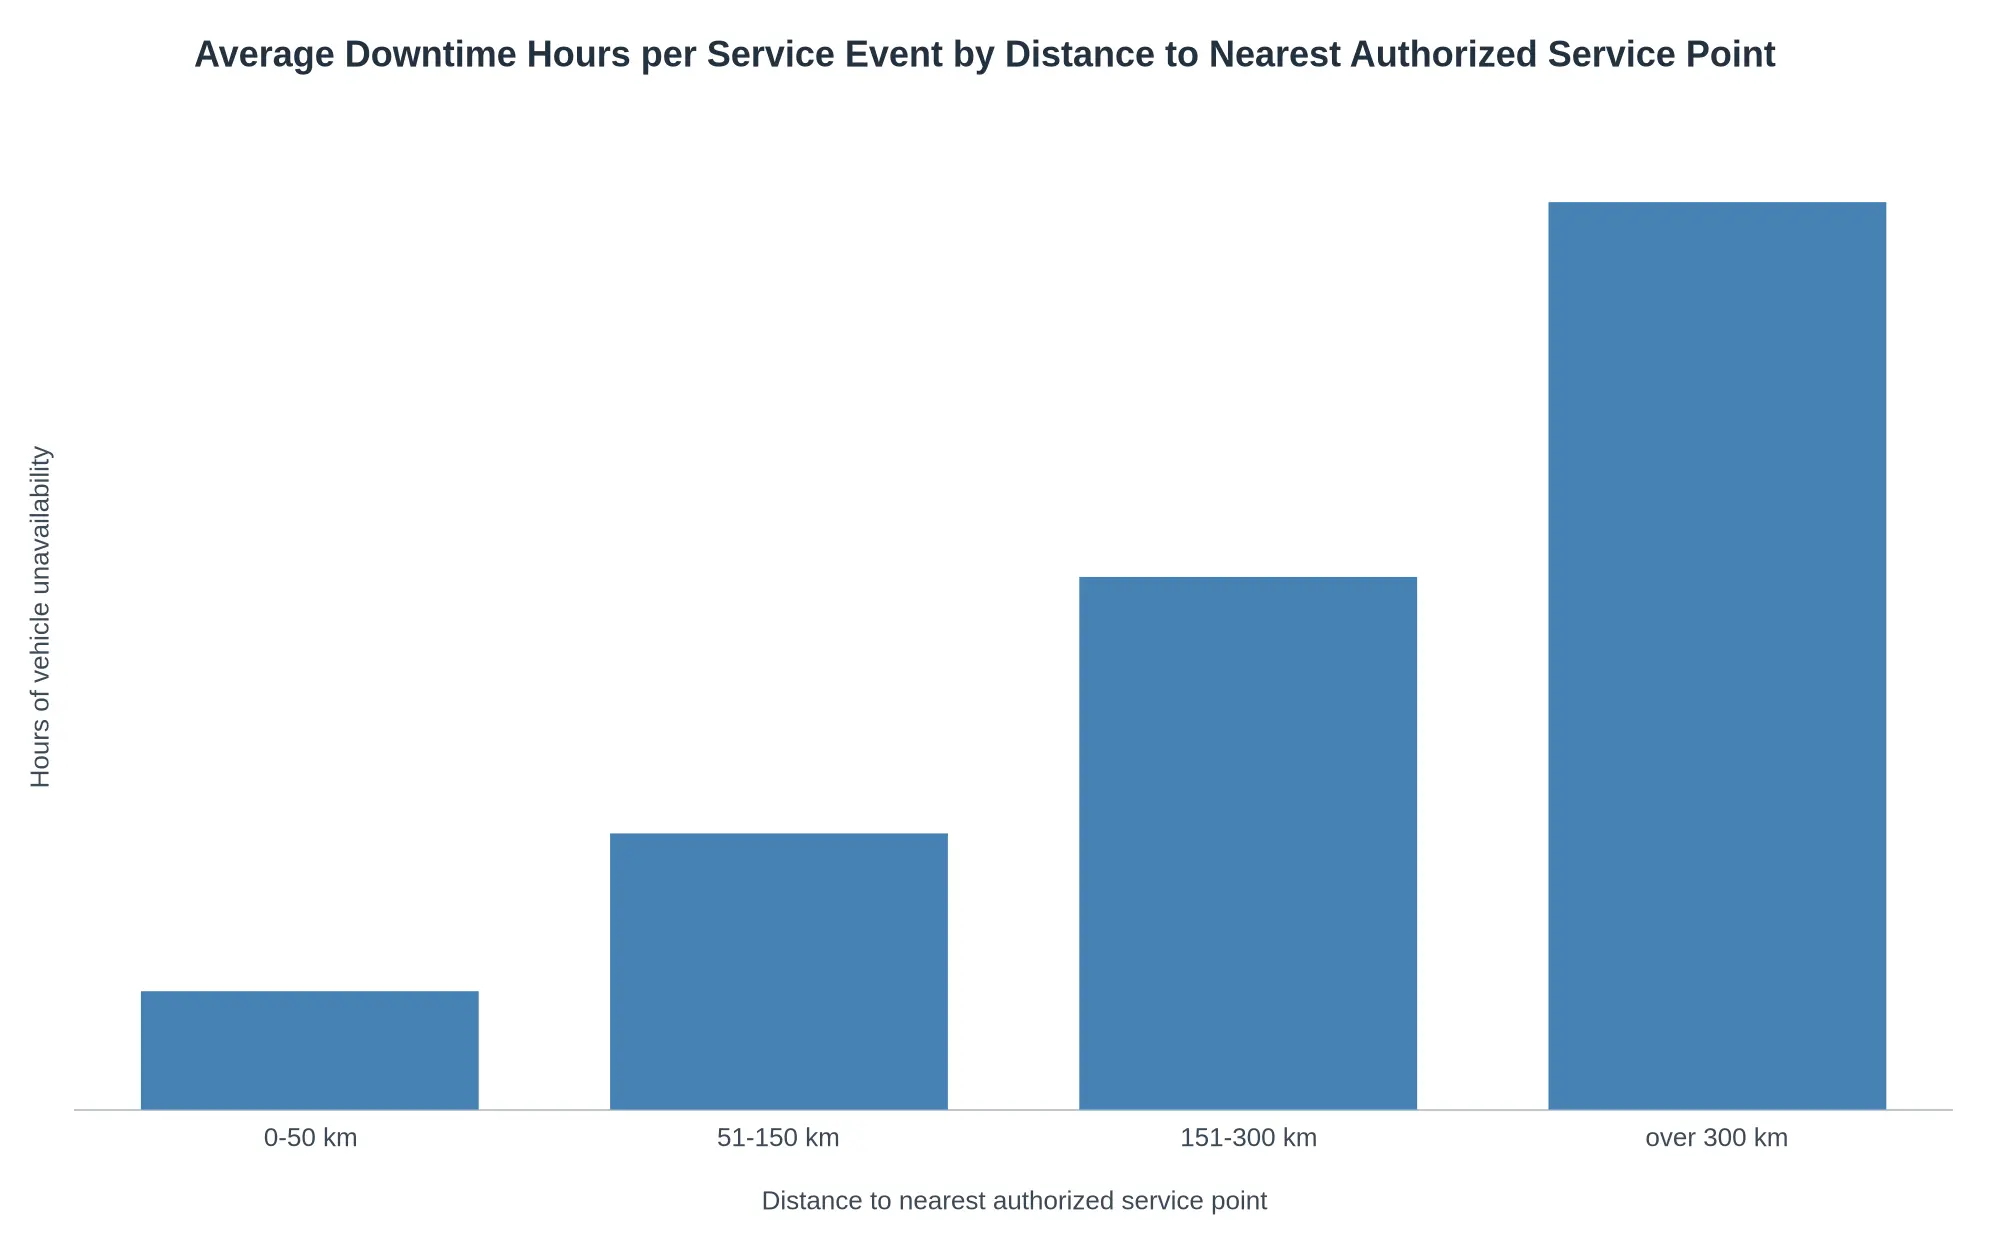
Average downtime hours per service event by distance to nearest authorized service point.
Downtime climbs from 6 hours inside a 50 km radius to 46 hours beyond 300 km. A rural buyer who prices proximity as a line item is pricing the number that decides how many trucks stay on the road.
Parts Logistics and Recovery: The Second Layer of Distance
Service distance has two components: how far the technician travels and how far the part travels. The slower of the two sets the repair clock, so a nearby branch does not by itself shorten downtime.
Start with stock depth. Most points carry fast-moving consumables – filters, belts, brake chambers, lamps. Pumps, transfer cases and proprietary control modules usually sit at a regional warehouse, which turns the closest branch into an ordering desk. Cross-shipment then adds receiving, staging and dispatch time on top of freight, and specialty valves or aerial hydraulic components can take two to three days.
Recovery becomes the binding constraint when the unit cannot be driven at all. Some rigs can be moved on their own power to a hard surface; others must be lifted and carried, which is where tow truck recovery transport comes in. Staged repairs need parts delivered to the site, handled by trailers for parts and equipment. Parts positioning and recovery capability describe a network; branch count does not.

The three rings map the travel time, and therefore the downtime, a rig absorbs at each distance band from the nearest service point.
How to Evaluate a Fire Apparatus Service Network Before You Commit
Audit a fire apparatus service network the way you audit any operating cost. The logo on the proposal says nothing about the response clock.
- Request the guaranteed response-time commitment in writing, including hours of coverage, escalation contacts, and penalties or remedies if the clock runs past the stated window.
- Map actual drive time from your operating base to each authorized service point, using road conditions and seasonal closures rather than straight-line mileage quoted in a brochure.
- Confirm which parts are stocked locally versus shipped, and ask for the specific lead times on wear items like pumps, braking systems, aerial hydraulics, and electrical components.
- Verify technician certification coverage for the specific apparatus systems on your units, and confirm how many certified techs are on site during your stated response window.
- Price the recovery and transport arrangement for an immobilized unit, including hook fees, mileage charges, and whether transport to an authorized point is included, referencing tow truck configurations for your chassis class.
A network passes only if the written terms, mapped drive times, stocked parts, certified coverage, and recovery pricing together keep downtime and lifetime cost predictable. If any one of them is missing, fail it and keep shopping.
Reading the downtime mix before you compare price tags
Break a rural department’s annual off-road hours into five buckets and the pattern is hard to miss. Most of the lost time goes to moving people, parts, and rigs across distance; very little of it goes to turning wrenches. The length of the service chain outweighs the skill inside any single shop.
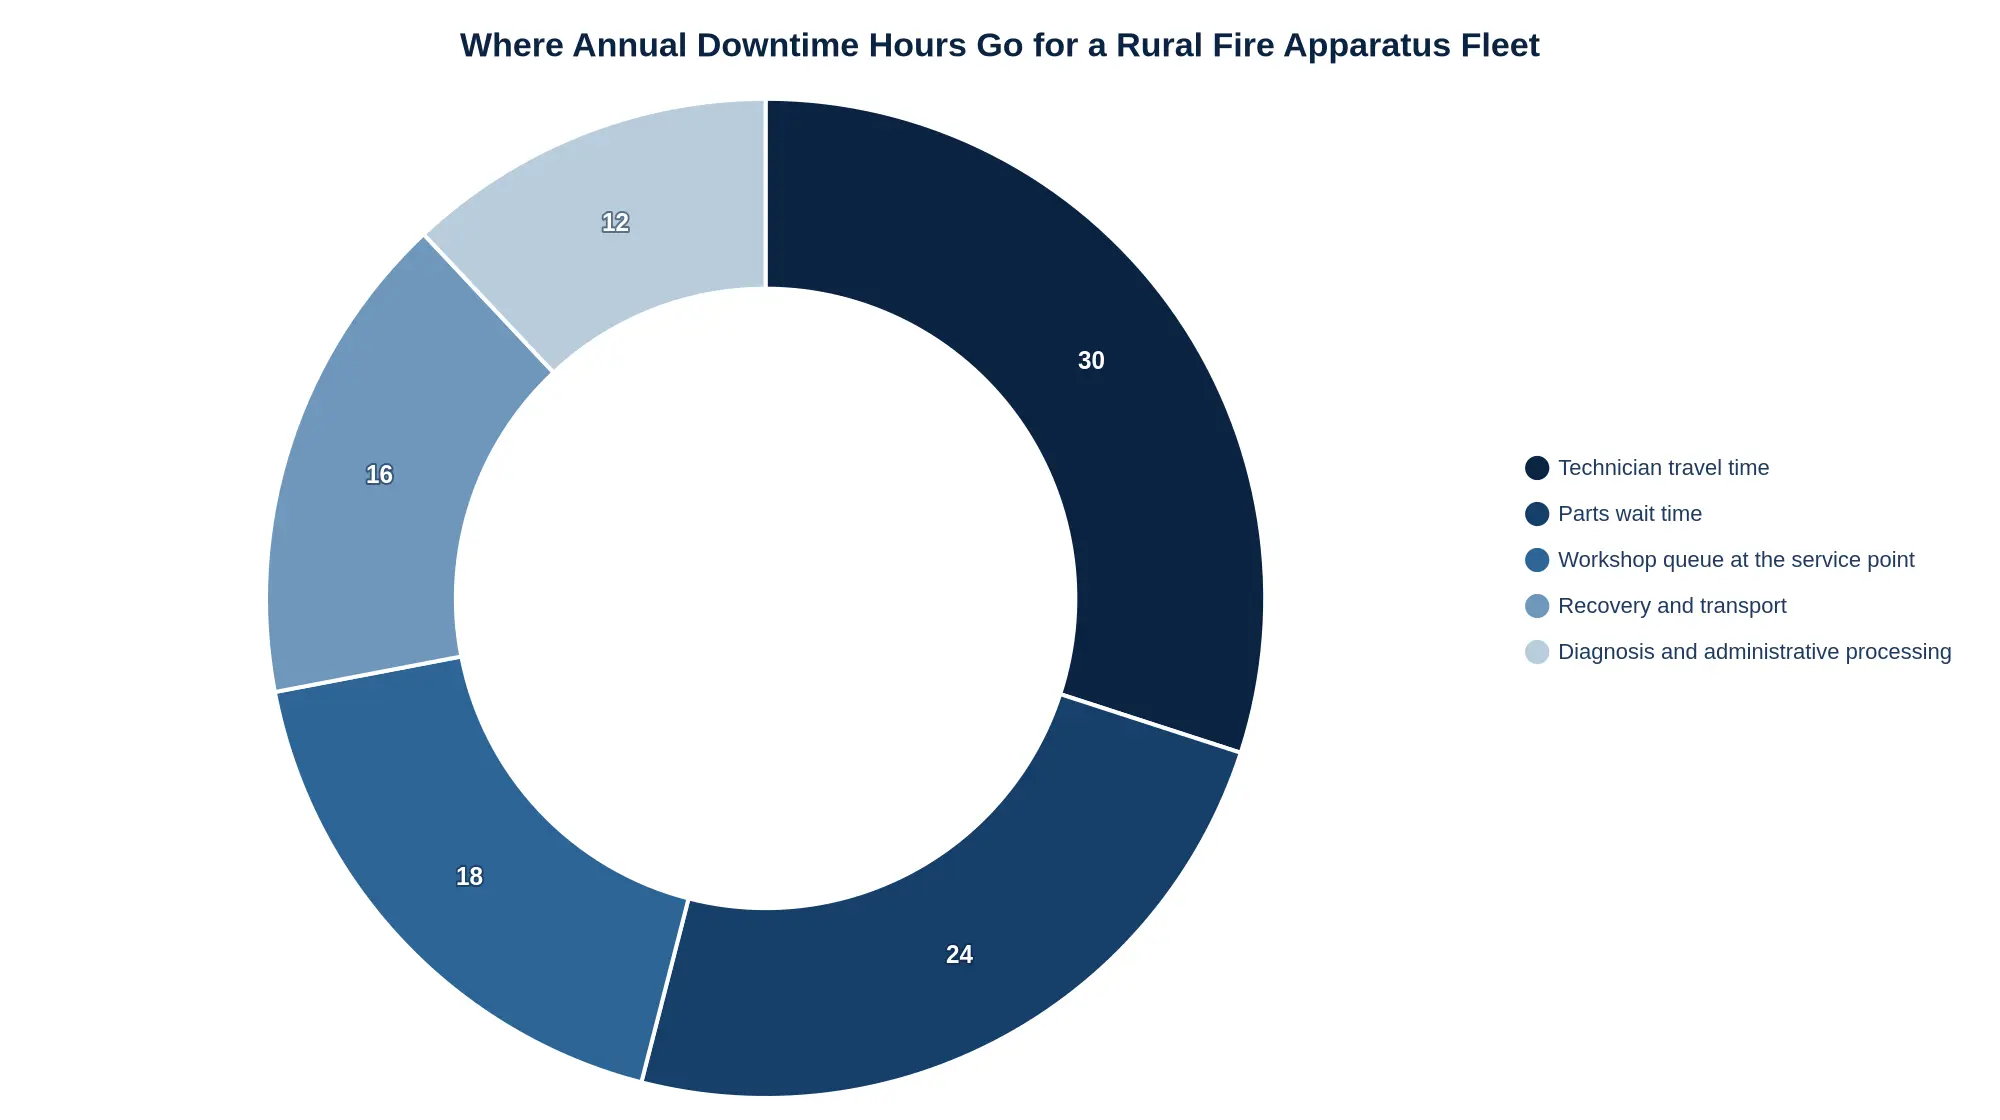
A buyer holding two bids should weigh the coverage difference as recovered service days, not as a discount. A network with a certified technician and a stocked parts bench an hour away beats a cheaper truck that ships hundreds of miles for every repair. Compare municipal fleet options by how close the support actually sits.
Budgeting Uptime: What the Numbers Look Like Over a Full Cycle
Put uptime in the annual budget as a line item instead of letting it land in the contingency fund mid-year. Fleets rarely lose availability because of sticker price. They lose it because nobody costed the drive to the nearest bay.
Assume 2-4 service events per year per unit, each costing 6-10 hours of travel and labour inside a 50-75 mile band, rising to 14-22 hours beyond 100 miles. Add the daily cost of an unavailable unit, typically $600-$1,500 in contracted replacement capacity.
Annual availability = 8,760 hours – (service events x hours per event) – (down days x hours of replacement coverage).
Run those ranges through a typical depot and most operators land near 92-96% availability, a planning range rather than a claim about any named market. Score network coverage alongside price during procurement: the density of fire apparatus service network partners and shared depot options matters as much as the invoice. Compare notes with neighbouring municipal service fleets that can share depot coverage before signing anything.
Frequently Asked Questions
For background on how municipal fleet configuration affects lifecycle cost, review the municipal vehicle lineup before starting a bid.
Can a Lower Listed Price for Brindlee Mountain Fire Apparatus Still Mean a Lower Total Cost?
No. A lower sticker price does not guarantee a lower lifetime cost. Purchase price is typically a small share of a 15- to 20-year ownership total, while transport and downtime absorb the rest. Compare cost per available service day rather than invoice totals.
How Do You Measure Service Network Distance Objectively?
Measure it by drive time, not ZIP-code radius. The practical test is one-way travel hours to the nearest stocked service bay, weighted by how many bays sit within four hours. That describes a fire apparatus service network more honestly than a map radius does. Request those figures before bidding.
How Does a Parts Stocking Policy Affect Downtime Hours?
Stocking policy sets how many days a unit sits waiting. Vehicles that need dealer-only parts commonly wait several weeks for delivery, while locally stocked consumables are replaced the same day. Confirm which parts are held on-site and which are ordered per incident.
What Contractual Commitments Should a Buyer Require in Writing?
Written commitments covering response times, parts availability, warranty labor rates, and remedies for missed deadlines. Verbal assurances carry no weight once a vehicle is out of service; a service-level clause with defined penalties converts promises into enforceable terms. Attach the schedule to the contract.
The Decision Rule for Rural Fire Apparatus Buyers
Score service network distance before listed price, because distance sets the ceiling on availability. A truck priced low but serviced eight hours away is not cheaper, it is slower, and the department pays for that gap at every unplanned outage. When reviewing municipal vehicle options, score dealer coverage first.
Guaranteed response time carries the heaviest weight: a documented service-hour commitment should outweigh a modest price gap, because every hour beyond it leaves a station uncovered. Parts positioning comes next. Confirm regional stock of common components, and treat any discount smaller than expedited freight as no discount. Recovery capability decides how long a truck sits idle, so weigh mobile repair support against price and discount quotes that leave recovery to a distant dealer.
Then test any quoted price advantage against your projected annual downtime hours.
Distance, not price, is what protects rural fleet uptime.