

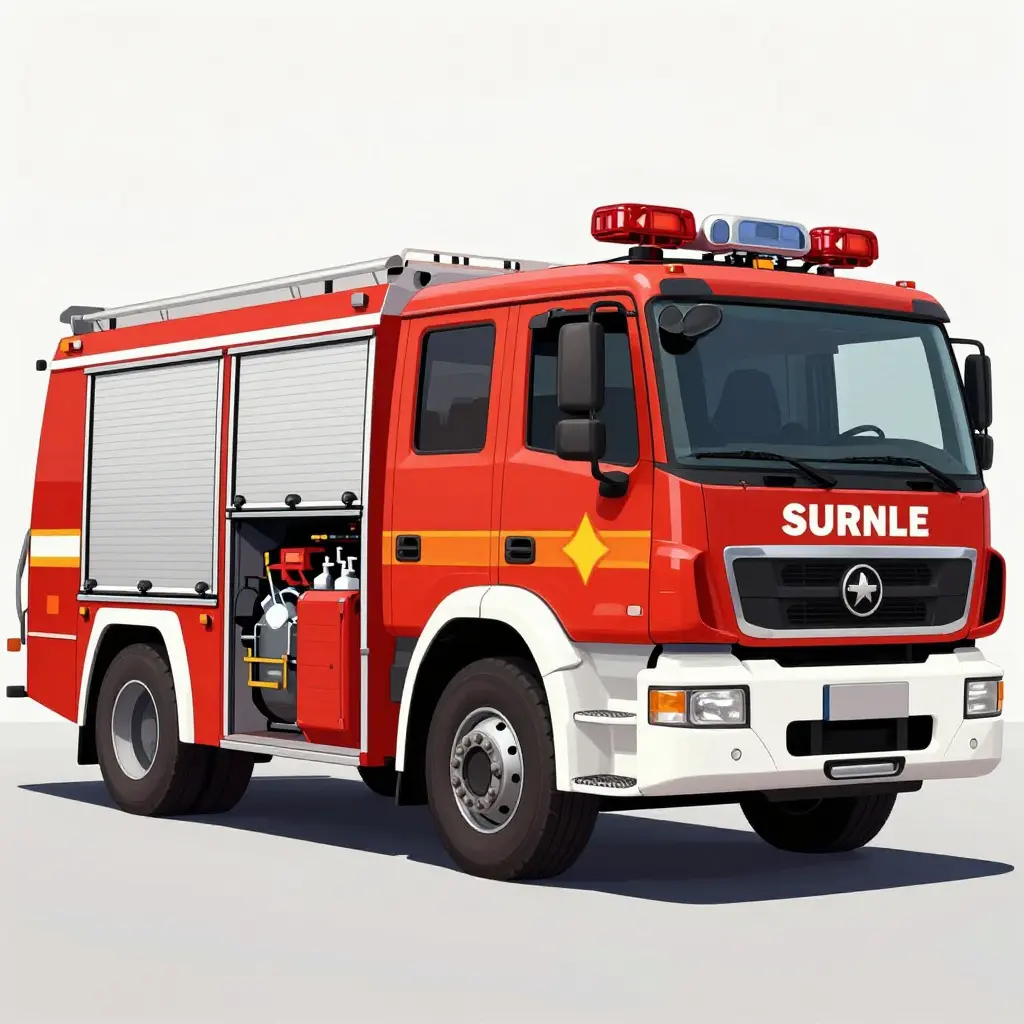
The Core Claim: Auxiliary Load, Not Engine Displacement, Decides Fire Truck Fuel Consumption
A fire truck’s diesel bill is set by what the engine drives while the truck stands still, not by how many litres of displacement sit under the cab. Pumps on power take-off (PTO), foam proportioning systems, scene lighting arrays, hydraulic rescue tools and aerial hydraulics all draw shaft power from the same engine, and most of them run with the wheels stopped. A crew holding high discharge pressure through a long job can burn more diesel than the drive out and back took.
That matters when a water tender is specified. A tanker shuttling between a fill point and a fireground covers very few kilometres and delivers thousands of litres a shift, so the working range of one tank of diesel depends on three things: how long the pump and proportioning runs, how much water goes on target each trip, and how much fuel each auxiliary burns per hour. Displacement tells you about acceleration and gradeability. It says almost nothing about how long a parked tanker can keep pumping. For fleet buyers comparing municipal vehicle platforms, the number worth asking for is auxiliary duty hours per tank of fuel, not cylinder volume.
Why Auxiliary Load Moves Fire Truck Fuel Burn More Than Displacement
Most of a working truck’s engine hours pass at standstill. The chassis is parked, the engine keeps turning, and the PTO – a split-shaft gear on the transmission or a dedicated crank-driven take-off – hands that rotation to the pump and, on some builds, to a compressor or generator. From that moment the engine is not moving the vehicle at all. Everything it burns is answering pump load rather than the odometer.
Fuel burn follows the power demanded, not the size of the block. Brake-specific fuel consumption (BSFC), in grams per kilowatt-hour, is a curve rather than a constant, and most diesels are most efficient somewhere in the middle of their load band, where friction and pumping losses are spread across a large useful output.
So a large engine at moderate load can drink less than a small engine held near its limit. Keep a small engine at high load through a long pumping period and it sits outside its efficient island: exhaust temperature climbs, the fan runs at full duty, and the fuel map adds margin to protect the turbo and exhaust components. Give the same pump load to a bigger engine and it carries it at a smaller fraction of capacity, in a better part of the curve, with less heat to reject.
Moving water ties the argument to the pump curve. Hydraulic power is flow multiplied by pressure, so the energy spent per litre of water climbs steeply as nozzle pressure and hose friction rise. Double the pressure at the same flow and you roughly double the shaft work, and roughly double the fuel burn in litres per hour. When buyers compare options across a municipal vehicle range, the number that predicts range is the duty point – flow, pressure, hours – not cylinder count.
Displacement is fixed at the factory. Auxiliary load changes with every call, and it is the one the fuel gauge responds to.
Where the fuel actually goes: load source contribution to fire truck fuel burn
Every auxiliary on a tanker takes shaft work from the same engine, so they compete for the same litres. The table puts indicative numbers on each load, so a procurement discussion can move from engine size to how hard the truck actually works.
| Load source | Indicative power draw (kW) | Indicative fuel draw at working load (L/h) | Typical share of a working-day fuel budget | Common buyer assumption |
|---|---|---|---|---|
| Transit drivetrain | 80-200 | 18-45 | 20-50%, rising with shuttle length | “Engine size is the whole story” |
| PTO water pump at rated flow | 60-150 | 14-36 | 25-45% | “Pumping is nearly free once we arrive” |
| Foam proportioning system | 2-10 | 0.5-2.5 | Under 2% | “Foam systems are a hidden drain” |
| Scene lighting and electrical load | 3-15 | 0.7-3.6 | 1-5% | “Lights are too small to matter” |
| Hydraulic rescue tools | 5-20 | 1.2-5 | 1-4% | “Short bursts, so negligible” |
| Aerial ladder or monitor hydraulics | 15-60 | 3.6-14 | 3-12% | “Aerial work is a niche add-on” |
| Idle and standby | 5-20 | 1.2-4.8 | 5-20% | “Idling costs almost nothing” |
Note: fuel figures are derived from a specific consumption of roughly 0.24 L per kWh of shaft work – about 200 g/kWh, which is close to the best point of a modern diesel and therefore optimistic for lightly loaded items. The share column overlaps because not every system runs on every call, and the transit share grows with shuttle distance. Real figures will shift with pump rating, PTO ratio, hydraulic configuration and duty cycle.
Read the block as a ranking rather than a spec sheet. Two loads, road transit and PTO pumping at rated flow, usually settle most of the fuel bill; the rest are levers you can pull in service. The balance between those two rows moves with how far the water has to come, so matching PTO capability and pump rating to the real call profile matters more than headline displacement.
Turning auxiliary draw into a fuel figure needs a spec sheet, a pen and a duty cycle you have actually settled on. Once the method is fixed, it can be run for every unit in a fleet without renegotiating assumptions each time.
- Identify the rated power draw of each auxiliary. List every consumer separately – pump drive or PTO-driven equipment, scene lighting, compressors, ventilation, cab and body HVAC – and take rated kW or horsepower from nameplates or manufacturer data rather than from memory.
- Convert draw to hourly fuel volume using a specific-consumption figure. Multiply each rated output by the brake-specific fuel consumption of the engine or generator serving that load, in g/kWh, then convert grams to litres or gallons with fuel density so every line lands in the same unit.
- Multiply by expected hours at working load per shift. Use realistic loaded hours for each item rather than shift length, because lighting, compressors and pump drives rarely run continuously across a full call-out.
- Add idle and transit consumption. Fold in engine idle during staging and the fuel burned moving between water points and the station: empty running still draws down the tank and still shapes tanker range.
- Divide fuel carried by the total. Take usable tank capacity and divide it by the summed hourly burn from steps two to four to get delivered tanks per full fuel load.
The output is a defensible ceiling rather than a brochure claim. Because auxiliary load dominates the arithmetic, every kilowatt you trim or loaded hour you remove converts directly into more tanks delivered between refills. Run the calculation across candidate chassis on our municipal fire and utility platforms before the route discussion begins, and fire truck fuel consumption stops being a talking point and becomes an input you control.
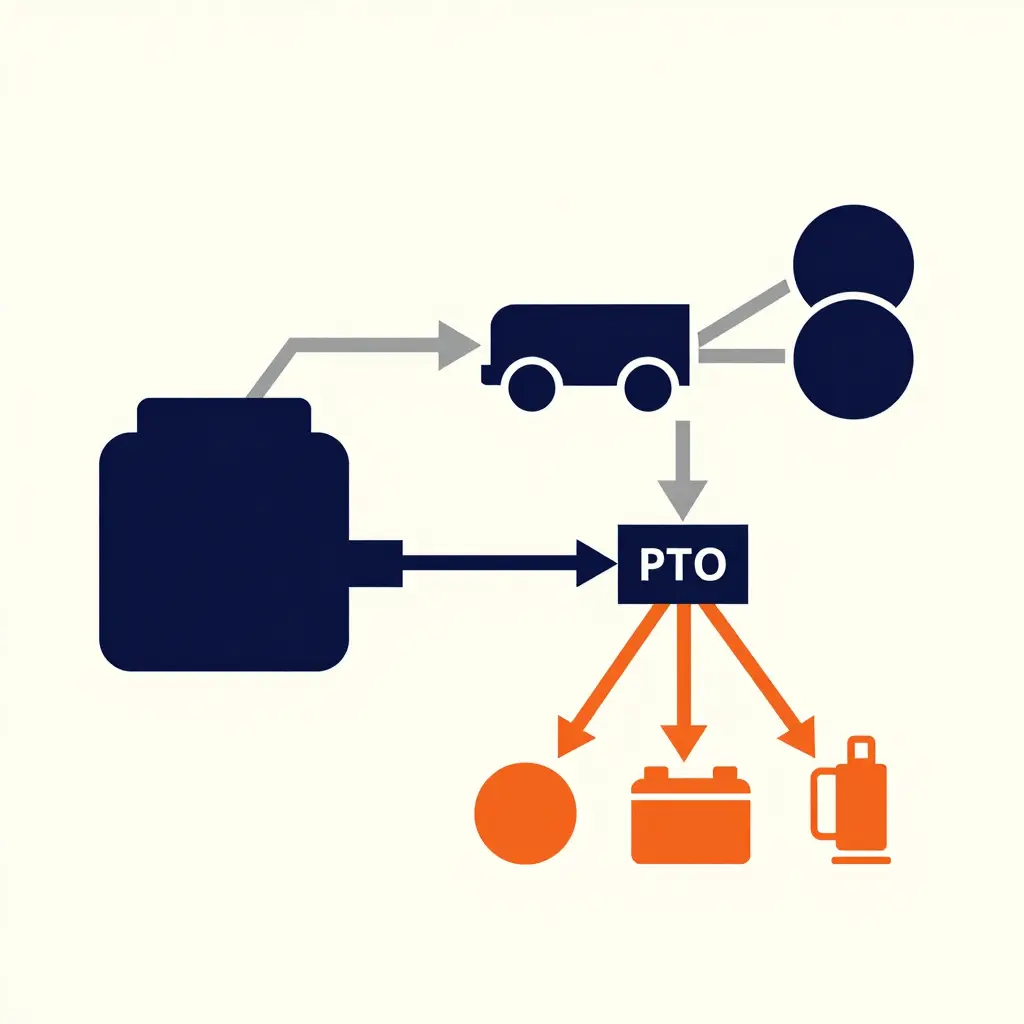
Figure: Two paths out of the same engine block – one to the wheels, one to the pump, the lights and the hydraulics. The heavier arrows are the ones that quietly drain the tank.
Converting Auxiliary Fuel Burn into Tanker Range
Once the hourly auxiliary burn is known, what is left is arithmetic, provided the numbers on both sides of the division are the right ones. Nominal tank capacity is not.
Step 1: Convert nominal capacity into usable water volume
A tank’s nameplate figure describes the shell, not the water you can put on a fire. Three things eat into it:
- Top expansion space – typically 3-5% of shell volume, kept empty so water does not vent when the truck leans or the load heats up.
- Displacement – baffles, internal pipework and fittings occupy real space.
- Suction submergence – the pump needs water above the intake to avoid cavitation, so it stops drawing before the tank is dry.
Those three overlap rather than add, which is why the total lands at 94-96% of nominal. A 16,000 L tank realistically delivers about 15,200 L.
Step 2: Account for residual and unusable volume
Every delivery leaves a heel behind – commonly 150-400 L sitting below the suction point, plus whatever clings to the shell and stays trapped in low spots. That residual is fuel burned to move water you never delivered, so it comes off before you divide fuel by water. Treating a tank as empty because it is “almost empty” flatters the result.
Step 3: Work out fuel consumed per tank delivered
This is the number most operators get wrong, because they measure pump time instead of auxiliary run time. One delivery cycle includes positioning, filling, pumping out and hose handling, and the engine burns at working RPM through all of it, including the minutes when nothing is flowing.
Fuel per delivered tank = auxiliary burn rate (L/h) x auxiliary run time per cycle (hours)
Step 4: Count the refill cycles per full fuel load
Refill cycles = usable diesel volume / fuel per delivered tank
Using 200 L of usable diesel and three illustrative configurations (assumptions stated, arithmetic only, auxiliary fuel excluding transit):
| Configuration | Nominal tank (L) | Usable water per fill (L) | Aux fuel per delivered tank (L) | Refill cycles per 200 L | Delivered water per full fuel load (L) |
|---|---|---|---|---|---|
| Large tank + high-flow pump | 16,000 | 15,200 | 17.6 | ~11 | ~167,000 |
| Balanced tank + moderate pump | 10,000 | 9,500 | 6.8 | ~29 | ~276,000 |
| Modest tank + disciplined auxiliary use | 6,000 | 5,650 | 2.6 | ~77 | ~435,000 |
Transit is left out of the table on purpose, so the counts are a ceiling. Add the drive between fill point and fireground and the cycles fall, sharply on a long shuttle and only slightly in a town where the hydrant is a few streets away.
Why ‘Range’ Should Mean Delivered Water Volume per Fill
Kilometres describe travel. For a tanker the output is water on target, and a vehicle that covers hundreds of kilometres while delivering half the water of a smaller, better-run unit has not gained range in any sense that shows up in a fuel bill.
So express tanker range as delivered water volume per fill of fuel – litres delivered before the auxiliary tank runs dry. That single figure carries tank size, residual losses, pumping efficiency and operator discipline, and it compares directly against fuel cost per thousand litres delivered.
Why a Big Tank Plus High Flow Shortens the Deliverable Tank Count
High flow is not free per litre. Hose friction rises with the square of flow, so doubling the flow through the same hose can take roughly four times the pressure to push it, and the power drawn then rises faster than the litres per minute do. Add a large tank that takes longer to fill and longer to empty, and the standing minutes accumulate at both ends of the cycle.
The result is fewer refill cycles from the same fuel load: a tank that looks impressive on a spec sheet while converting diesel into noise and heat.
A modest tank with disciplined auxiliary use works the other way. Lower flow rates move less water per minute, but pressure loss and power fall faster than the transfer time lengthens, so the fuel per delivered litre usually drops; short cycles cut idle time, and shutting the auxiliary down between tasks stops the bleed altogether. More refill cycles fit into one fuel load, and because residual volume scales with tank size, the smaller tank also wastes less water each time it empties.
The conclusion is uncomfortable for spec-sheet comparison: size the pump to the task. If the duty cycle is short transfers and frequent moves, a smaller tank with an engine that gets switched off between jobs will out-deliver a big-tank, high-flow unit on both litres and fuel cost. Reviewing liquid-waste tanker configurations is a sensible starting point for matching shell size and pumping capacity to the work the truck actually does.
Range, for a tanker, is a volume rather than a distance, and most of it is decided in the yard.
Auxiliary Load in Litres per Hour, System by System
Before arguing about engine size, look at what the engine is being asked to spin. The chart below splits an indicative hourly burn into its auxiliary pieces, so the relative weight of each subsystem is visible instead of guessed.
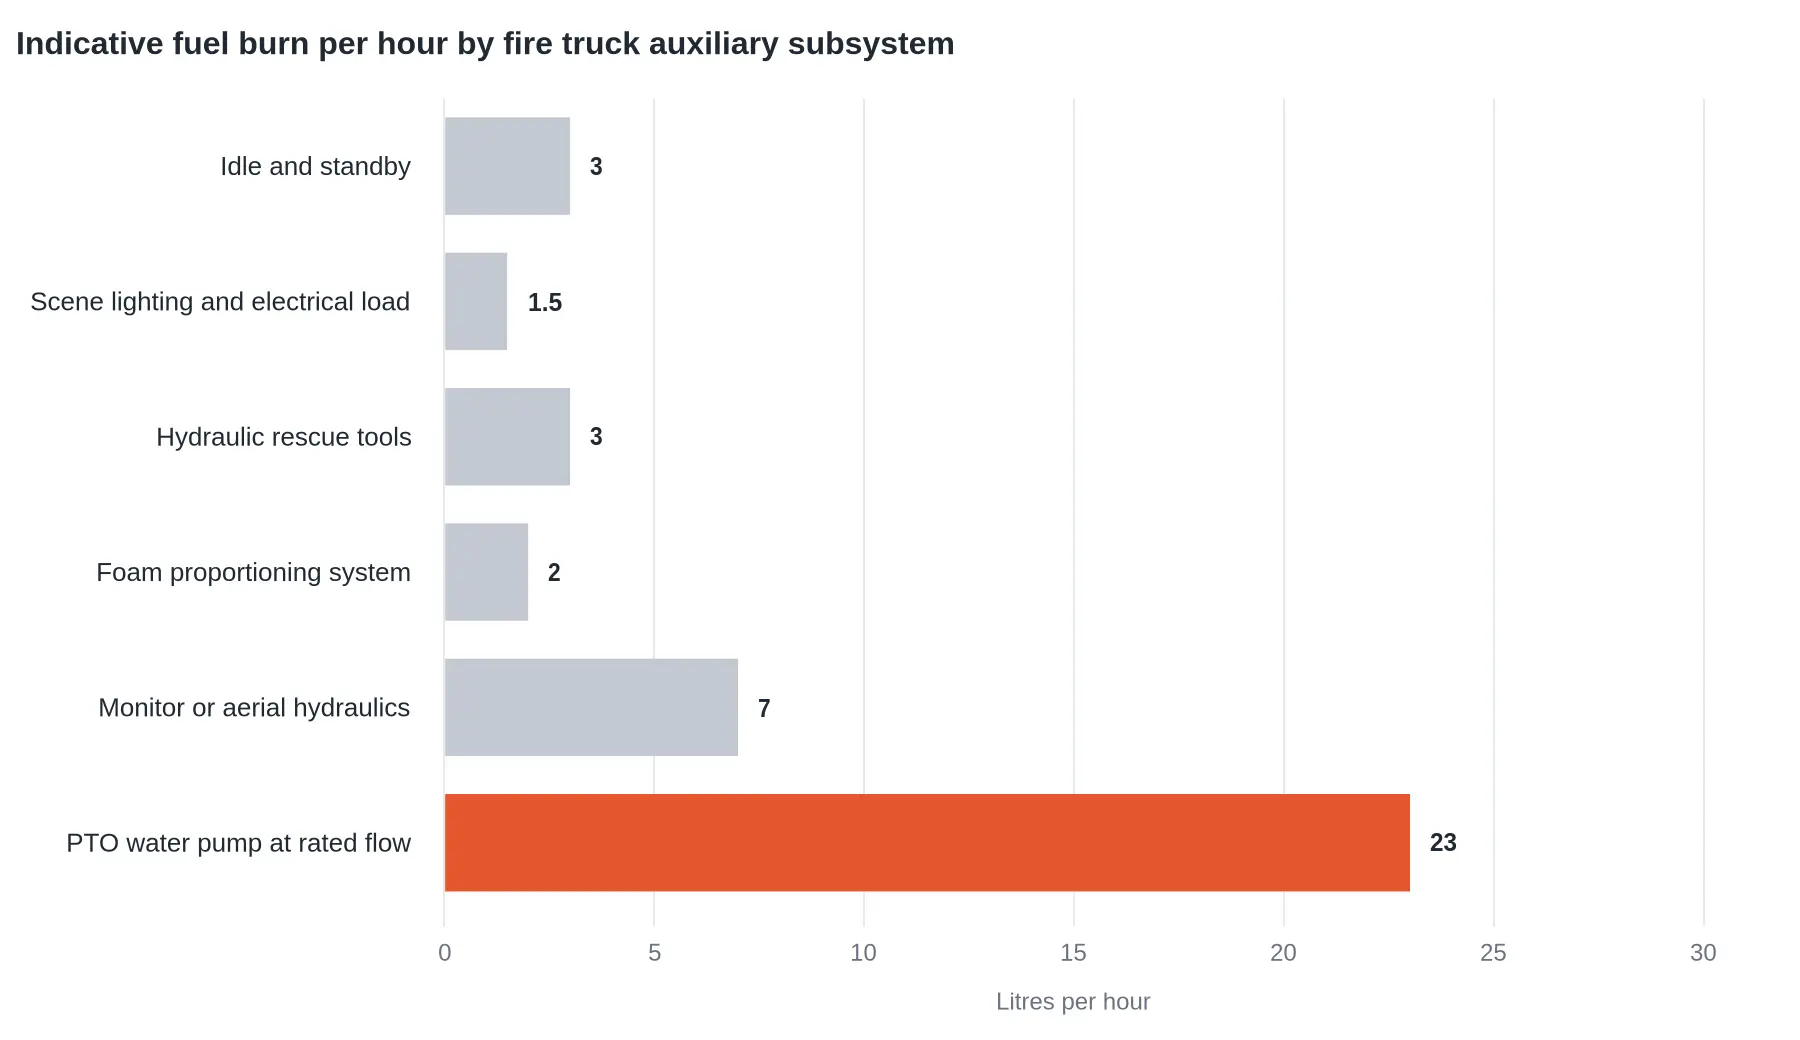
Indicative fuel burn per hour by fire truck auxiliary subsystem; the ranges are converted to one representative value each, and pump rating and PTO ratio will shift them up or down.
| Auxiliary subsystem | Indicative range (L/h) | Value plotted (L/h) |
|---|---|---|
| PTO water pump at rated flow | 14 – 36 | 23 |
| Monitor or aerial hydraulics | 3.6 – 14 | 7 |
| Foam proportioning system | 0.5 – 2.5 | 2 |
| Hydraulic rescue tools | 1.2 – 5 | 3 |
| Scene lighting and electrical load | 0.7 – 3.6 | 1.5 |
| Idle and standby | 1.2 – 4.8 | 3 |
The pump bar tells the story
The pump bar stands about three times higher than the monitor bar and seven to fifteen times higher than the electrical and foam bars. With the PTO engaged and the pump at rated flow, the engine is pushing hydraulic power through the driveline continuously, and on a long structural job that load empties a tanker’s diesel tank, not the drive to the scene. The monitor, foam system, rescue tools and lighting matter for operational readiness, but in fuel terms they sit an order of magnitude below a pump at full rating.
Three practical takeaways for fleet owners:
- Specify the pump to the real duty cycle. A pump oversized for typical calls runs at flows and pressures nobody needs, and the invoice arrives in litres every hour the PTO stays engaged.
- Check the PTO ratio and driveline efficiency. Two trucks with the same pump can burn noticeably different amounts of fuel, depending on how the PTO steps up drive speed and how much parasitic loss sits between engine and impeller.
- Manage idle time as a line item. Idle and standby accumulate hours quietly across a shift; combined with a spinning pump, that is where fuel budgets go.
If you are specifying a new unit and want the auxiliary load matched to your call profile, take a look at the municipal vehicle range we build, and we can go through pump sizing, PTO configuration and realistic tanker range with your own numbers.
Operational Levers That Extend Tanker Range
Auxiliary load is the part of the fuel equation a crew can control on shift, and the fastest gain is simply not feeding the pump when nothing is drawing on it. Seven levers, roughly in order of payoff:
- Match pump speed and flow to real demand. Set pump rpm to what the nozzle or monitor is actually flowing instead of running at maximum rated output out of habit; a pump working half as hard burns far less fuel per delivered litre.
- Avoid stacking high-draw auxiliaries. Pump, deck monitor, scene lighting and a ventilation fan at once spikes demand; stagger them so peak draw stays low.
- Limit unproductive idle and PTO time. Long warm-ups, standing by with the PTO engaged and idling between calls burn fuel without moving a drop of water.
- Schedule refill movements around pumping demand. Send the tanker to fill in low-demand windows rather than mid-delivery, so the drive cycle and the pumping cycle do not compete.
- Monitor hourly fuel burn data. Trust logged litres-per-hour readings from your own fleet over displacement assumptions; they usually point at auxiliary draw rather than engine size.
- Specify tank volume against typical delivery distance. A slightly larger tank on a municipal liquid-waste or water body often removes a refill trip altogether, which beats any tuning tweak.
- Track short and long runs separately. Two similar trucks on the same route can differ sharply once auxiliary duty cycle is logged, so compare like with like before calling a vehicle inefficient.
None of these needs new hardware. Each one shrinks the auxiliary share of fire truck fuel consumption, and that share is what decides how far a tanker delivers before the next fill.
A Buyer’s Specification Checklist: Six Numbers Worth Putting Side by Side
Engine displacement is usually the first figure on a datasheet and the one that tells you least about running cost. It describes the swept volume inside the cylinders, which says nothing about the work being asked for. Two trucks with the same 6.7-litre block can land a third apart on fuel burn once one of them is spinning a larger pump, driving a heavy-duty alternator and holding pressure at a monitor for two hours. The gap lives in the auxiliary load, which is something you can specify, quote and score. Here is a checklist to hand to any supplier.
The comparison sheet
| Specification item | Why it moves fuel burn | What to put on your sheet |
|---|---|---|
| PTO power rating and ratio | The PTO is where engine power leaves the driveline; a higher absorbed kW means more fuel burned per hour even when the truck is stationary | Absorbed power in kW at rated engine speed, PTO gear ratio, engine-driven vs split-shaft, and whether the rating is continuous or intermittent |
| Pump rated flow and pressure | Flow and pressure together are the real work demand; quoting flow alone hides how hard the engine is working | Rated flow in L/min at a stated pressure in bar, at a stated engine rpm, plus the flow-pressure curve |
| Electrical alternator capacity | Scene lighting, beacons and tool charging all draw from the alternator, and electrical load is carried by the engine as fuel | Amps at idle and at rated rpm, continuous vs peak output, and total connected lighting and tool load in the cab and body |
| Usable tank volume | Nominal litres are not deliverable litres; baffles, dead space and pipework reduce what actually reaches the pump | Usable vs nominal volume, water delivered per trip, and refill or turn-around time at your filling point |
| Fuel tank capacity vs expected pumping hours | Range is hours of pumping, not kilometres | Tank litres, expected burn rate at pumping duty, and the resulting continuous pumping hours before the truck must leave the scene |
| Hourly fuel-burn data or telematics | Without a measured figure, every comparison is guesswork | A measured L/h figure at a defined duty cycle, or a telematics package that logs fuel rate, idle time and PTO hours |
How to read the differences
PTO and pump figures go together. A pump rated at high flow and high pressure absorbs more power, so ask for both numbers at the same engine speed. An offer quoting 3,000 L/min with no pressure stated cannot be compared with one that states both.
Alternator capacity is often under-specified. Buyers add lighting towers and corded tools after delivery, then wonder why fuel burn climbs. Ask what the alternator delivers at idle, not just at highway rpm, and what the connected auxiliary load budget is.
Fuel tank size should be converted into hours. Divide usable litres by the expected hourly burn at pumping duty. A 200-litre tank and a 300-litre tank look similar on paper until one gives three hours on scene and the other four and a half.
A fair way to run the tender
Give every supplier the same duty cycle – for example, two hours of pump operation at a stated flow and pressure with lights and tools running – and ask each to quote litres per hour for that cycle. Compare cost per pumping hour rather than cost per litre of displacement. It is also worth asking how each product family quotes fire truck specifications in its documentation, to see whether the numbers you want are standard or optional. Browse the municipal product range to see how specifications are presented across families before building the comparison sheet.
Where a Full Tank Actually Goes
Displacement gets the blame for thirsty tankers, but a fuel tank empties by work performed. The doughnut below splits a full load of diesel across the duty phases that consume it.
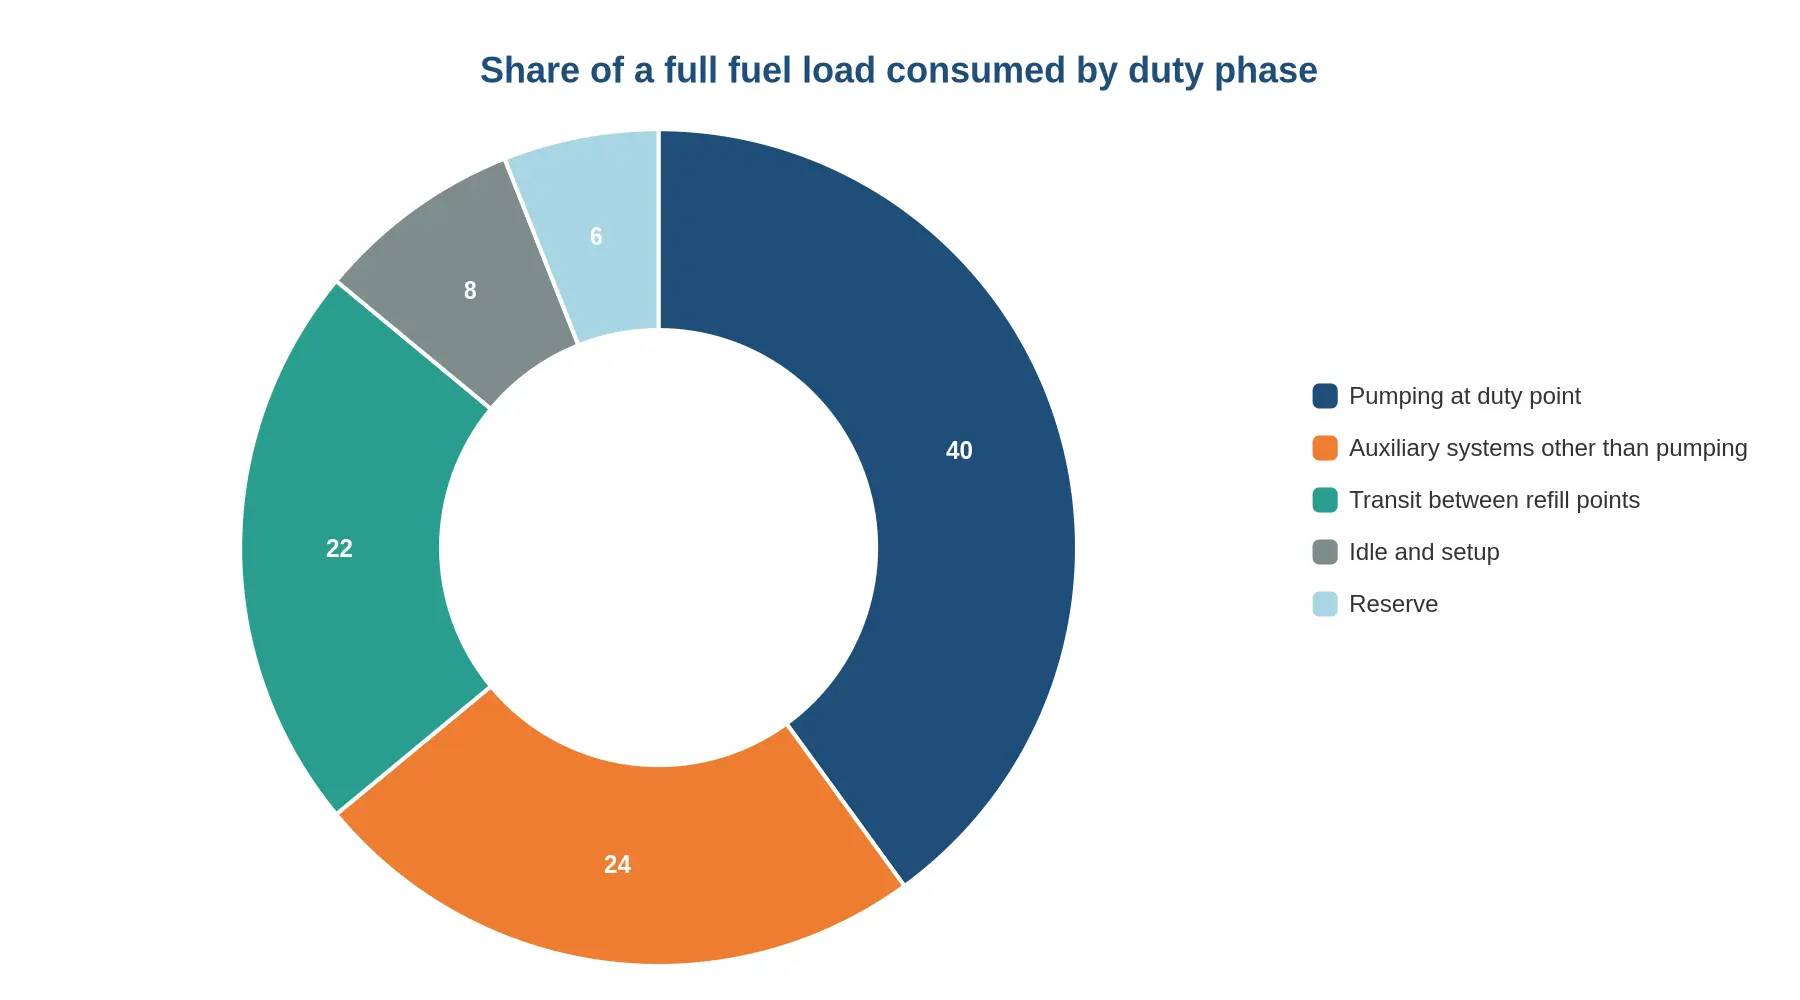
Figure 2: Share of a full fuel load consumed by duty phase. Percentages are indicative and illustrate a representative tanker duty cycle rather than a measured test result. This one is a short-shuttle cycle: stretch the distance between fill point and fireground and the transit slice grows at the expense of the pumping slice.
Reading the Slices
- Pumping at duty point (40%) – the largest single draw, scaling with how long the pump runs, how hard it works against head pressure, and how many refill cycles a shift demands.
- Auxiliary systems other than pumping (24%) – lighting towers, hydraulic circuits, compressors, crew comfort and electronics. Invisible on the engine spec sheet, yet nearly a quarter of the load.
- Transit between refill points (22%) – rolling fuel, the portion most people assume dominates. It is real, but on this cycle it is not the biggest slice.
- Idle and setup (8%) – warm-up, staging, hose deployment and the minutes spent waiting for a call.
- Reserve (6%) – the buffer that keeps a truck from stranding itself; treat it as untouchable.
Pumping plus everything-else-auxiliary comes to nearly two thirds of the load. Two trucks with identical powerplants can post very different refill intervals if one runs lights and hydraulics continuously while the other sequences them, and that sequencing habit moves tanker range more than engine choice does.
Turning the Chart into a Purchasing Decision
For operators building or renewing a fleet, the question is not which engine is smaller but which accessories run, and for how long. Ask suppliers for auxiliary load in kilowatts as well as horsepower, and for pump duty curves at the head pressures your sites actually see. If you are comparing chassis across applications, the municipal fleet range is a reasonable place to match body configuration to duty cycle.
One exercise pays for itself quickly: log fuel issued and hours by phase for two weeks. Most teams find the auxiliary slice is larger than they assumed, and closing that gap costs less than shopping for a different engine.
Fleet Mix and Lifecycle Cost: Specify Around the Auxiliary Load
The auxiliary-load argument changes once a business runs more than one tanker. On a single fire tanker, engine displacement tends to dominate the specification sheet. Across a municipal or industrial fleet, the recurring cost depends on how much water each vehicle delivers per shift, how long its pump, vacuum unit or spray system runs, and how closely chassis and body match the route. The useful fleet metric is not fuel per kilometre alone but fuel spend and total cost of ownership per delivered cubic metre, per completed collection stop or per cleaned kilometre.
Right-sizing starts with tank volume. A larger tank adds payload only when axles, bridges and refill points support it; oversize it and you can lose legal payload, raise road fuel burn and leave the vehicle queueing at a slow fill point. A smaller tank with a faster fill and discharge cycle completes more trips. The planning relationship is simple: usable tank volume multiplied by completed cycles per shift gives delivered volume, and pump rating should be chosen against that cycle rather than against a headline flow figure. An undersized pump lengthens the shift and adds engine hours; an oversized one may run at a poor operating point, add parasitic load and wear faster. The same logic applies to vacuum pumps, spray pumps, blowers, generators and PTO-driven equipment.
| Fleet duty | Right-sizing focus | Effect on delivered output and cost |
|---|---|---|
| Urban water delivery with short refill legs | Tank volume matched to legal axle load; PTO pump matched to hydrant or fill-point flow | More completed cycles per shift; lower fuel per delivered m3; less idling at fill points |
| Liquid waste collection | Vacuum pump rating, tank shape and hose length matched to the collection cycle | Fewer engine hours per stop; lower auxiliary fuel burn; less downtime from mismatched equipment |
| Street cleaning and washing | Water capacity, spray pressure and scrubber load matched to route length and speed | Controlled auxiliary load during low-speed work; predictable fuel spend per cleaned kilometre |
| Dry cargo and dump work | Chassis payload, body mass and PTO demand matched to haul profile | More payload per trip and lower fuel per tonne-km where auxiliary load is modest |
Chassis and body choice should follow the duty cycle. A collection route needs a vacuum body, hose handling and tank shape that fit the stop pattern, which is why liquid waste tankers are specified around vacuum demand and cycle time. A sweep or wash route needs water capacity, spray pressure and scrubber load matched to route length and speed, which is the focus of road cleaning equipment. A dry-load route needs payload, body mass and PTO demand matched to haul distance and tip conditions, which is where chassis-based cargo platforms fit. Keeping those roles separate is often cheaper than forcing one platform into every task.
Fleet total cost of ownership should include acquisition, body upfit, fuel, DEF, maintenance, tyres, insurance, downtime and resale. A low purchase price can be offset by higher fuel spend, shorter service intervals or poor parts availability. Standardising on two or three configurations improves parts commonality and technician familiarity, while route-level right-sizing keeps auxiliary equipment from running above the load the work requires. For owners comparing replacements, the question is not which single tanker has more capacity but which mix delivers the required water volume, collection capacity or cleaning coverage at a lower cost per unit of service. CRRC (CCIG), founded in 2016 and headquartered in Suzhou, is a state-owned mixed-reform enterprise operating across five sectors including smart manufacturing and new energy vehicles, with two listed companies.
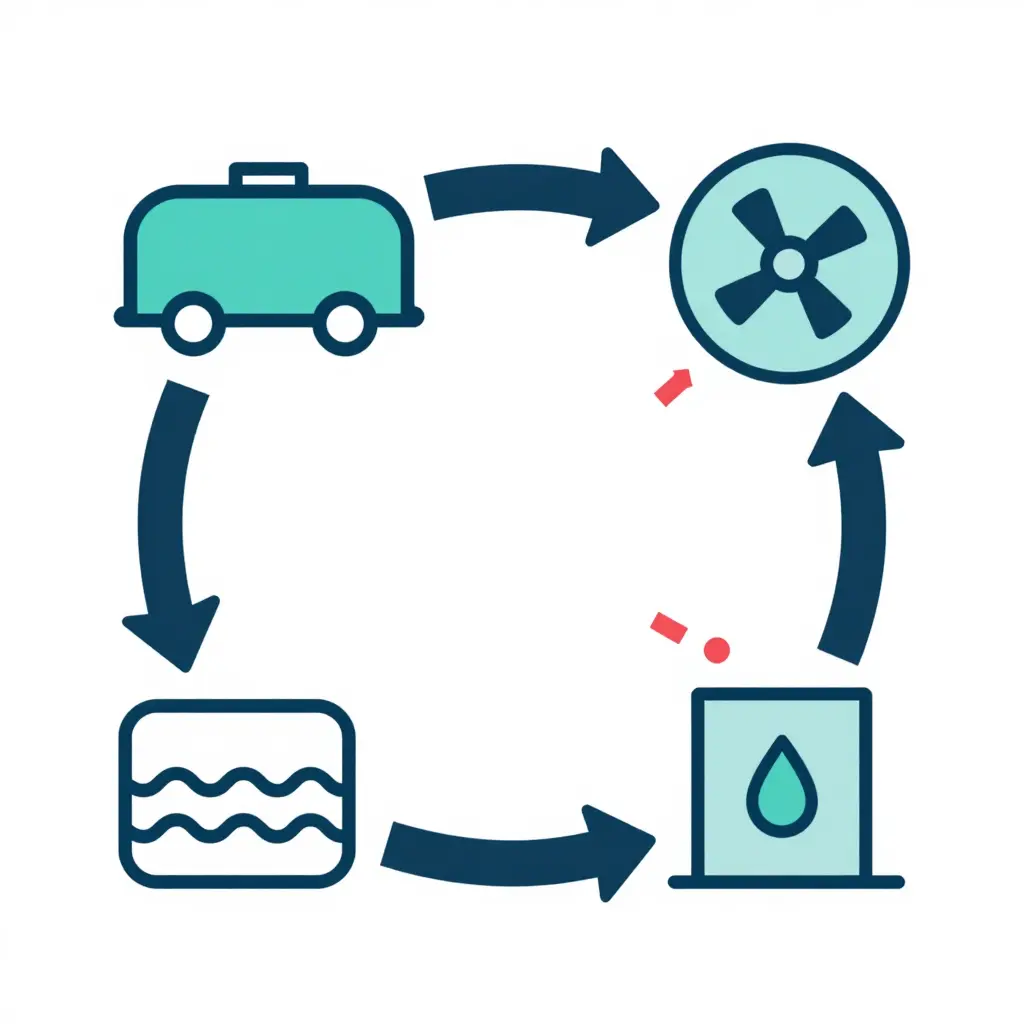
Read the loop clockwise: the tank empties at the delivery point, the truck runs light back to the refill source, and the pump load returns. Because each full circuit resets the tank, the honest measure of tanker range is how many gallons you deliver per refill cycle rather than the miles on the odometer. If your fleet’s loop is dictated by liquid payload rather than distance, explore our liquid-waste tanker bodies.
FAQ: Fire Truck Fuel Consumption and Tanker Range
Does a larger engine always mean higher fire truck fuel consumption?
No. Fire truck fuel consumption follows power demanded, not displacement. A large engine running at low load can burn less than a smaller engine held at high load. Pump and PTO demand set the burn, so displacement alone predicts nothing reliably.
How much fuel does a fire truck pump use per hour?
Indicative figures: a midsize pump flowing 1,000 to 1,500 gpm (about 3,800 to 5,700 L/min) with the PTO engaged draws roughly 5 to 10 gal/h (18 to 38 L/h) at ordinary discharge pressures. Higher discharge pressure, long hose runs and drafting duty all push it up, so ask for the figure at a stated pressure.
What tanker range should a buyer expect per full fuel load?
Count loads, not miles. On the 200 L tank used in the examples above, a 2,000-gallon tanker on a 10-mile shuttle completes roughly 8 to 12 full deliveries per fill, with the shuttle and the pump time both included. Tank size and pump duty across the municipal range move that number.
Does idle time really matter for auxiliary fuel burn?
Yes. Idle and standby with accessories running draw roughly 1 gal/h (about 4 L/h) while delivering no water. Two idle hours per shift cost about 2 gal, close to 4% of a 200 L working budget, before the pump turns over.
Can auxiliary load be reduced without lowering firefighting performance?
Yes, mainly by matching speed to flow. Run the pump at what the nozzle actually needs, trim PTO-driven accessories the job does not use, and shut down idle branches; delivered water volume at the fireground can stay unchanged.
Conclusion: Specify the Load, Not the Displacement
Auxiliary load governs real-world fuel burn; engine displacement is a weak proxy. Displacement predicts bench-test consumption far more reliably than it predicts what a working pumper or tanker burns across a shift of pumping, idling and short runs. Tanker range therefore belongs in the specification as delivered water volume per fuel load, and it should be managed in the same unit in service, with pump hours, appliance draw and idle time logged as deliberately as distance.
For buyers and fleet managers the comparison that matters is delivered water per tank of fuel under the duty cycle the vehicle will actually run, the auxiliary loads that cycle imposes, and the refill and turnaround assumptions written into each bid. Those three figures can be checked against tender documents before purchase and against duty logs afterwards, which makes them the practical basis for comparing the municipal vehicle configurations on offer and for holding a supplier to the range it promised.